
Overstock.com, Inc. (OSTK): Price and Financial Metrics
OSTK Price/Volume Stats
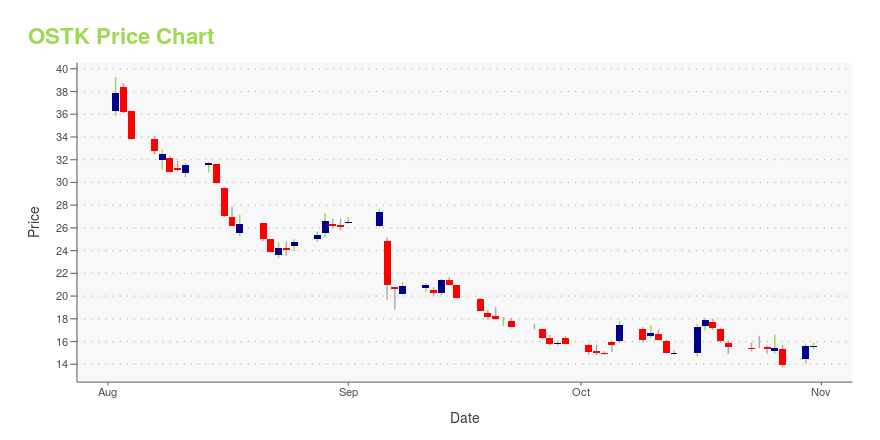
| Current price | $16.78 | 52-week high | $39.27 |
| Prev. close | $15.91 | 52-week low | $13.71 |
| Day low | $15.91 | Volume | 3,736,900 |
| Day high | $17.52 | Avg. volume | 2,050,246 |
| 50-day MA | $18.33 | Dividend yield | N/A |
| 200-day MA | $21.93 | Market Cap | 760.22M |
OSTK Stock Price Chart Interactive Chart >
Overstock.com, Inc. (OSTK) Company Bio
Overstock.com is an online retailer offering discount brand name, non-brand name and closeout merchandise, including furniture, home decor, bedding and bath, housewares, jewelry and watches, apparel and designer accessories, electronics and computers, and sporting goods, among other products. The company was founded in 1997 and is based in Salt Lake City, Utah.
Latest OSTK News From Around the Web
Below are the latest news stories about OVERSTOCKCOM INC that investors may wish to consider to help them evaluate OSTK as an investment opportunity.
This Overstock.com Director Just Bought $600,000 Worth of OSTK StockAlthough an Overstock insider buying up a large volume of OSTK stock is encouraging, the business still faces challenges. |
Director Marcus Lemonis Buys 40,293 Shares of Overstock.com IncOn October 27, 2023, Marcus Lemonis, a director at Overstock.com Inc (NASDAQ:OSTK), purchased 40,293 shares of the company. |
Here's Why Overstock.com Shares Went Up TodayShares of Overstock.com (NASDAQ: OSTK) went up today after one of its directors increased his ownership stake in the business. The market almost always views something like this in a positive light, and that's why Overstock was up 11% as of 2:15 p.m. ET on Monday. Not all insider trading is illegal; insiders naturally know information before the public, and they're allowed to buy and sell stock. |
Bankrupt, liquidated retailer making a massive comebackWhen a big-name brand goes bankrupt and has its intellectual property sold at auction, the buyer usually uses the name to leverage the recognition factor. The new owner of the brand has not tried to bring the company back as it was. Instead, the company that purchased the Sharper Image name has splashed it on low-end toys designed for adults. |
Overstock.com, Inc. (NASDAQ:OSTK) Q3 2023 Earnings Call TranscriptOverstock.com, Inc. (NASDAQ:OSTK) Q3 2023 Earnings Call Transcript October 26, 2023 Overstock.com, Inc. beats earnings expectations. Reported EPS is $-0.61, expectations were $-0.69. Operator: Good day and thank you for standing by. Welcome to the Q3 2023 Overstock.com Inc. Earnings Conference Call. At this time, all participants are in a listen-only mode. After the speakers’ […] |
OSTK Price Returns
| 1-mo | N/A |
| 3-mo | N/A |
| 6-mo | N/A |
| 1-year | -52.08% |
| 3-year | -78.53% |
| 5-year | -16.31% |
| YTD | N/A |
| 2023 | 0.00% |
| 2022 | -67.19% |
| 2021 | 23.01% |
| 2020 | 580.43% |
| 2019 | -48.09% |
Continue Researching OSTK
Want to do more research on Overstockcom Inc's stock and its price? Try the links below:Overstockcom Inc (OSTK) Stock Price | Nasdaq
Overstockcom Inc (OSTK) Stock Quote, History and News - Yahoo Finance
Overstockcom Inc (OSTK) Stock Price and Basic Information | MarketWatch
Loading social stream, please wait...