Ouster, Inc. (OUST): Price and Financial Metrics

Ouster, Inc. (OUST): $7.26

0.82 (+12.73%)

POWR Rating

Component Grades

Momentum

B

Stability

F

Sentiment

Quality

D

Add OUST to Watchlist
Sign Up

Industry: Technology - Electronics

Industry

C

Ranked

#36 of 41

in industry

OUST Price/Volume Stats

Current price $7.26 52-week high $23.00
Prev. close $6.44 52-week low $3.21
Day low $6.47 Volume 1,272,100
Day high $7.32 Avg. volume 603,534
50-day MA $5.55 Dividend yield N/A
200-day MA $10.37 Market Cap 281.80M

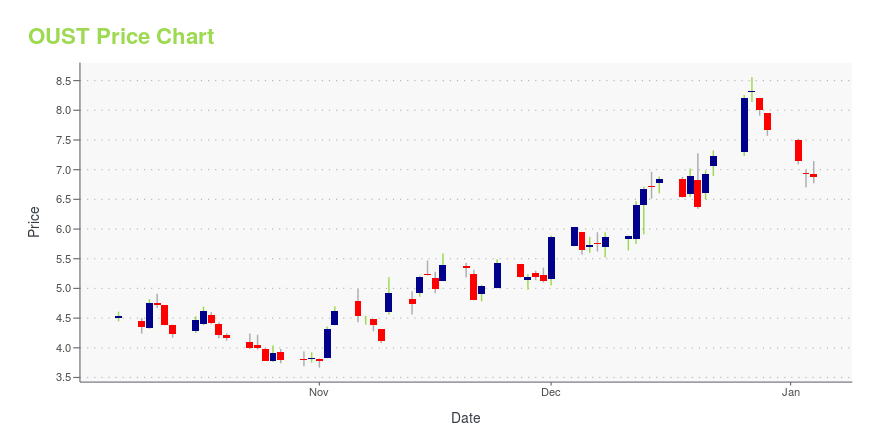
OUST Stock Price Chart Interactive Chart >

OUST POWR Grades

  • Momentum is the dimension where OUST ranks best; there it ranks ahead of 94.28% of US stocks.
  • OUST's strongest trending metric is Momentum; it's been moving up over the last 179 days.
  • OUST ranks lowest in Stability; there it ranks in the 1st percentile.

OUST Stock Summary

  • With a year-over-year growth in debt of 283.16%, OUSTER INC's debt growth rate surpasses 94.8% of about US stocks.
  • In terms of twelve month growth in earnings before interest and taxes, OUSTER INC is reporting a growth rate of 157.51%; that's higher than 91.44% of US stocks.
  • In terms of volatility of its share price, OUST is more volatile than 97.16% of stocks we're observing.
  • Stocks that are quantitatively similar to OUST, based on their financial statements, market capitalization, and price volatility, are NNOX, CODX, INFA, RELY, and STRC.
  • OUST's SEC filings can be seen here. And to visit OUSTER INC's official web site, go to ouster.io.

OUST Valuation Summary

  • OUST's EV/EBIT ratio is -0.7; this is 103.31% lower than that of the median Technology stock.
  • OUST's price/sales ratio has moved down 16.7 over the prior 33 months.

Below are key valuation metrics over time for OUST.

Stock Date P/S P/B P/E EV/EBIT
OUST 2023-05-22 4.9 0.8 -0.9 -0.7
OUST 2023-05-19 4.0 0.6 -0.7 -0.5
OUST 2023-05-18 4.2 0.6 -0.7 -0.6
OUST 2023-05-17 4.4 0.7 -0.8 -0.6
OUST 2023-05-16 4.6 0.7 -0.8 -0.7
OUST 2023-05-15 4.5 0.7 -0.8 -0.6

OUST's Quality Factors

The “Quality” component of the POWR Ratings focuses on 31 different factors of a companies fundamentals and operational strength. Here are some key insights as we drill into the specifics of these quality attributes.
  • OUST has a Quality Grade of D, ranking ahead of 6.85% of graded US stocks.
  • OUST's asset turnover comes in at 0.126 -- ranking 103rd of 104 Machinery stocks.
  • 500 - Internal server error

The table below shows OUST's key quality metrics over time.

Period Asset Turnover Gross Margin ROIC
2021-06-30 0.126 0.231 -1.185

Ouster, Inc. (OUST) Company Bio


Ouster, Inc. engages in the provision of high resolution digital lidar sensors that offer advanced 3D vision to machinery, vehicles, robots, and fixed infrastructure assets. The company was founded on June 30, 2015 and is headquartered in San Francisco, CA. The listed name for OUST is Ouster, Inc.


OUST Latest News Stream


Event/Time News Detail
Loading, please wait...

OUST Latest Social Stream


Loading social stream, please wait...

View Full OUST Social Stream

Latest OUST News From Around the Web

Below are the latest news stories about OUSTER INC that investors may wish to consider to help them evaluate OUST as an investment opportunity.

ITC Institutes Investigation into Hesai’s Unlawful Use of Ouster’s Patents

SAN FRANCISCO, May 18, 2023--Ouster, Inc. (NYSE: OUST) ("Ouster" or the "Company"), a leading provider of high-performance lidar sensors for the automotive, industrial, robotics, and smart infrastructure industries, announced today that the U.S. International Trade Commission (ITC) has voted to institute an investigation into the unfair trade practices of Hesai Group (Nasdaq: HSAI) based in Shanghai, China, and related entities.

Yahoo | May 18, 2023

Ouster to Present at Upcoming June 2023 Investor Conferences

SAN FRANCISCO, May 17, 2023--Ouster, Inc. (NYSE: OUST) ("Ouster" or the "Company"), a leading provider of high-performance lidar sensors for the automotive, industrial, robotics, and smart infrastructure industries, announced today that its CEO, Angus Pacala, and CFO, Mark Weinswig will be attending and presenting at the following upcoming investor conferences.

Yahoo | May 17, 2023

Ouster Announces Expansion of Supply Agreements with May Mobility to Support Autonomous Vehicle Deployments Around the Globe

SAN FRANCISCO, May 16, 2023--Ouster, Inc. (NYSE: OUST), a leading provider of high-performance lidar sensors, and May Mobility, a leader in the development and deployment of autonomous vehicle (AV) technology, announced today expansions to their supply agreements to provide lidar sensors for May Mobility’s autonomous vehicle solutions. These expansions include a binding commitment for a combined purchase of over one thousand Ouster OS1 and Alpha PrimeTM VLS-128 sensors through 2024 to meet deman

Yahoo | May 16, 2023

Ouster Exceeds Q1 2023 Revenue Guidance; Increases Target for Merger Cost Synergies

SAN FRANCISCO, May 11, 2023--Ouster, Inc. (NYSE: OUST) ("Ouster" or the "Company"), a leading provider of high-performance lidar sensors for the automotive, industrial, robotics, and smart infrastructure industries, announced today financial results for the three months ended March 31, 2023. First quarter 2023 financial results are composed of Ouster standalone performance through February 10, 2023 and combined performance of both companies following the merger with Velodyne on February 10, 2023

Yahoo | May 11, 2023

Ouster Awarded Production Win by Motional to be the Exclusive Supplier of Long-Range Lidar for its Autonomous Vehicles

SAN FRANCISCO, May 11, 2023--Ouster, Inc. (NYSE: OUST), a leading provider of high-performance lidar sensors, announced today that Motional, a global leader in driverless technology, has selected Ouster as the exclusive provider of long-range lidar sensors for its all-electric IONIQ 5-based robotaxis. The serial production agreement will see Ouster supply Motional with Alpha Prime™ VLS-128 sensors through 2026.

Yahoo | May 11, 2023

Read More 'OUST' Stories Here

OUST Price Returns

1-mo 107.43%
3-mo -32.15%
6-mo -47.39%
1-year -67.00%
3-year N/A
5-year N/A
YTD -15.87%
2022 -83.40%
2021 -61.48%
2020 N/A
2019 N/A
2018 N/A

Get Free Updates

Join thousands of investors who get the latest news, insights and top rated picks from StockNews.com!