
Oak Valley Bancorp (CA) (OVLY): Price and Financial Metrics
OVLY Price/Volume Stats
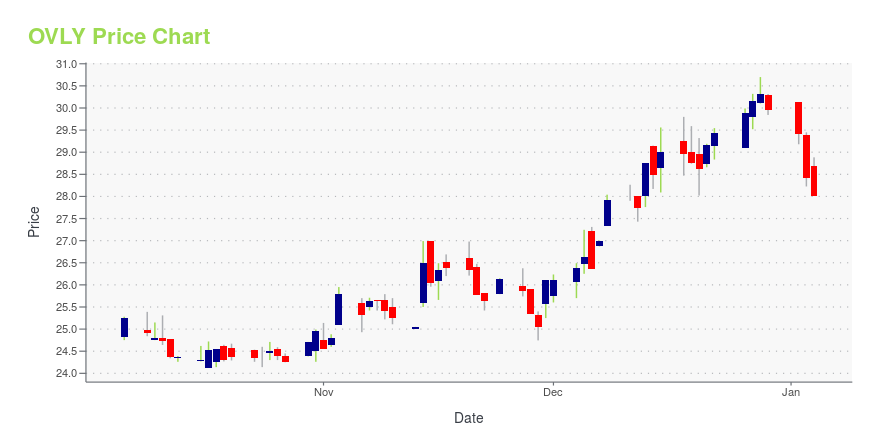
| Current price | $27.37 | 52-week high | $30.70 |
| Prev. close | $26.89 | 52-week low | $22.91 |
| Day low | $26.92 | Volume | 15,000 |
| Day high | $27.37 | Avg. volume | 12,434 |
| 50-day MA | $24.51 | Dividend yield | 1.67% |
| 200-day MA | $25.22 | Market Cap | 228.81M |
OVLY Stock Price Chart Interactive Chart >
Oak Valley Bancorp (CA) (OVLY) Company Bio
Oak Valley Bancorp operates as the holding company for Oak Valley Community Bank that provides banking products and services for individuals and business enterprises in Oakdale, California and the surrounding areas. The company was founded in 1990 and is based in Oakdale, California.
Latest OVLY News From Around the Web
Below are the latest news stories about OAK VALLEY BANCORP that investors may wish to consider to help them evaluate OVLY as an investment opportunity.
Here's Why We Think Oak Valley Bancorp (NASDAQ:OVLY) Is Well Worth WatchingFor beginners, it can seem like a good idea (and an exciting prospect) to buy a company that tells a good story to... |
Risk and Reward: 3 Bank Stocks for the Bold InvestorAfter navigating the crisis earlier this year that roiled regional bank stocks, the coast is clear to dive into this sector, right? |
Oak Valley Bancorp (NASDAQ:OVLY) shareholders have earned a 9.0% CAGR over the last five yearsWhen you buy and hold a stock for the long term, you definitely want it to provide a positive return. Furthermore... |
Oak Valley Bancorp (OVLY) Reports Q3 2023 Earnings: Net Income of $7.35 MillionDespite a slight decrease from the prior quarter, the bank's net income shows a year-over-year increase |
Oak Valley Bancorp Reports 3rd Quarter ResultsOAKDALE, Calif., Oct. 19, 2023 (GLOBE NEWSWIRE) -- Oak Valley Bancorp (NASDAQ: OVLY) (the “Company”), the bank holding company for Oak Valley Community Bank and their Eastern Sierra Community Bank division, recently reported unaudited consolidated financial results. For the three months ended September 30, 2023, consolidated net income was $7,354,000, or $0.89 per diluted share (EPS), as compared to $8,404,000, or $1.02 EPS, for the prior quarter and $6,800,000, or $0.83 EPS, for the same period |
OVLY Price Returns
| 1-mo | 14.66% |
| 3-mo | 12.45% |
| 6-mo | -0.18% |
| 1-year | 0.72% |
| 3-year | 65.79% |
| 5-year | 54.22% |
| YTD | -7.85% |
| 2023 | 33.87% |
| 2022 | 32.36% |
| 2021 | 6.53% |
| 2020 | -13.03% |
| 2019 | 7.90% |
OVLY Dividends
| Ex-Dividend Date | Type | Payout Amount | Change | ||||||
|---|---|---|---|---|---|---|---|---|---|
| Loading, please wait... | |||||||||
Continue Researching OVLY
Here are a few links from around the web to help you further your research on Oak Valley Bancorp's stock as an investment opportunity:Oak Valley Bancorp (OVLY) Stock Price | Nasdaq
Oak Valley Bancorp (OVLY) Stock Quote, History and News - Yahoo Finance
Oak Valley Bancorp (OVLY) Stock Price and Basic Information | MarketWatch
Loading social stream, please wait...