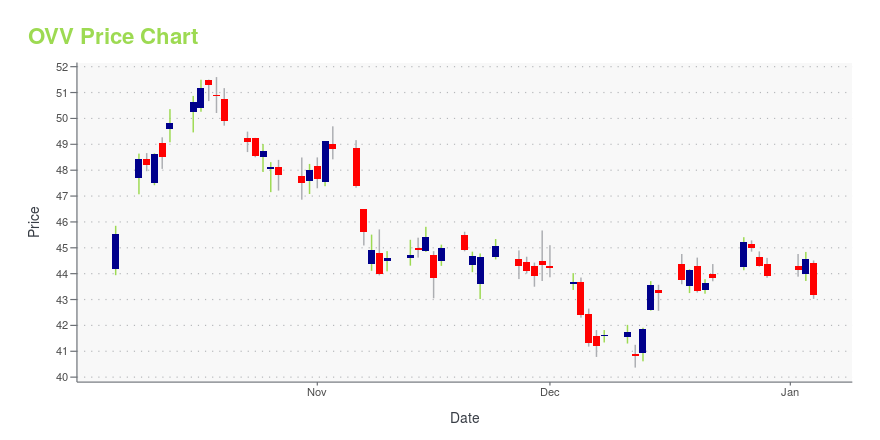
Ovintiv Inc. (OVV): Price and Financial Metrics
OVV Price/Volume Stats
| Current price | $46.05 | 52-week high | $55.95 |
| Prev. close | $45.85 | 52-week low | $39.68 |
| Day low | $45.34 | Volume | 3,239,559 |
| Day high | $46.25 | Avg. volume | 3,018,319 |
| 50-day MA | $47.71 | Dividend yield | 2.59% |
| 200-day MA | $47.24 | Market Cap | 12.29B |
OVV Stock Price Chart Interactive Chart >
Ovintiv Inc. (OVV) Company Bio
Ovintiv Inc. operates as an energy producer. The Company focuses on developing its multi-basin portfolio of oil, natural gas liquids, and natural gas producing plays. Ovintiv serves clients in the United States and Canada.
Latest OVV News From Around the Web
Below are the latest news stories about OVINTIV INC that investors may wish to consider to help them evaluate OVV as an investment opportunity.
Does The Energy Sector Have The Energy To Offer Good Investments?While some companies have struggled in recent years, there are opportunities for growth and attractive valuations. |
2 Stocks in the Canadian Upstream Industry Worth a Closer LookFollowing a careful analysis of the Zacks Oil and Gas - Exploration and Production - Canadian industry, we advise focusing on companies like CNQ and OVV. |
13 Most Promising Energy Stocks According to AnalystsIn this article, we discuss the 13 most promising energy stocks according to analysts. To skip the overview of the energy sector, go directly to the 5 Most Promising Energy Stocks According to Analysts. Despite the global push toward clean energy, fossil fuels have shown their impact on the economy in recent years. While renewable […] |
Wall Street Analysts Just Trimmed Price Targets for These 10 StocksIn this article, we will discuss the 10 stocks whose price targets were recently trimmed by analysts. If you want to see more such stocks on the list, go directly to Wall Street Analysts Just Trimmed Price Targets for These 5 Stocks. In the latest market developments on December 18, Asian stocks experienced a notable decline, […] |
3 Undervalued Stocks Poised to Outperform Their Respective IndicesYou really don’t need much explanation regarding the allure of undervalued stocks. |
OVV Price Returns
| 1-mo | 0.17% |
| 3-mo | -12.98% |
| 6-mo | 8.77% |
| 1-year | 10.09% |
| 3-year | 81.31% |
| 5-year | 157.23% |
| YTD | 6.14% |
| 2023 | -10.93% |
| 2022 | 53.29% |
| 2021 | 137.51% |
| 2020 | -34.90% |
| 2019 | -16.03% |
OVV Dividends
| Ex-Dividend Date | Type | Payout Amount | Change | ||||||
|---|---|---|---|---|---|---|---|---|---|
| Loading, please wait... | |||||||||


Loading social stream, please wait...