Blue Owl Capital Inc. (OWL): Price and Financial Metrics

Blue Owl Capital Inc. (OWL): $10.96

0.54 (+5.18%)

POWR Rating

Component Grades

Momentum

A

Stability

C

Sentiment

Quality

C

Add OWL to Watchlist
Sign Up

Industry: Asset Management

Industry

D

Ranked

#47 of 54

in industry

OWL Price/Volume Stats

Current price $10.96 52-week high $14.04
Prev. close $10.42 52-week low $8.06
Day low $10.35 Volume 4,706,500
Day high $11.05 Avg. volume 3,584,177
50-day MA $10.58 Dividend yield 5.49%
200-day MA $11.04 Market Cap 15.42B

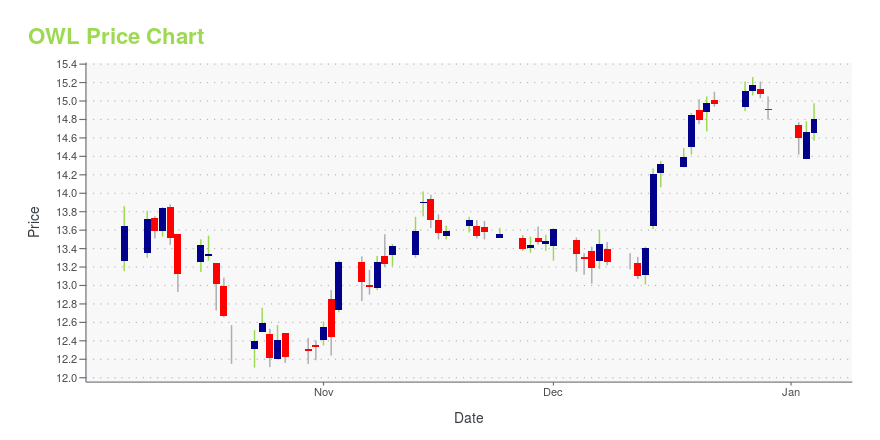
OWL Stock Price Chart Interactive Chart >

OWL POWR Grades

  • OWL scores best on the Growth dimension, with a Growth rank ahead of 94.66% of US stocks.
  • OWL's strongest trending metric is Quality; it's been moving up over the last 179 days.
  • OWL's current lowest rank is in the Sentiment metric (where it is better than 9.08% of US stocks).

OWL Stock Summary

  • OWL has a higher market value than 95.04% of US stocks; more precisely, its current market capitalization is $43,894,995,687.
  • OWL's current price/earnings ratio is 4,048.23, which is higher than 99.81% of US stocks with positive earnings.
  • With a price/sales ratio of 29.56, BLUE OWL CAPITAL INC has a higher such ratio than 95.31% of stocks in our set.
  • Stocks with similar financial metrics, market capitalization, and price volatility to BLUE OWL CAPITAL INC are LEV, SITM, RMNI, INFU, and TDW.
  • To dig deeper into the stock's financial statements, go to OWL's page on browse-edgar?action=getcompany&CIK=0001823945.

OWL Valuation Summary

  • OWL's EV/EBIT ratio is 668.2; this is 6087.04% higher than that of the median Financial Services stock.
  • Over the past 31 months, OWL's EV/EBIT ratio has gone up 657.9.

Below are key valuation metrics over time for OWL.

Stock Date P/S P/B P/E EV/EBIT
OWL 2023-05-19 29.9 27.9 4092.9 668.2
OWL 2023-05-18 29.7 27.7 4064.5 663.8
OWL 2023-05-17 30.1 28.1 4117.3 672.0
OWL 2023-05-16 29.6 27.7 4056.4 662.5
OWL 2023-05-15 30.4 28.4 4158.0 678.4
OWL 2023-05-12 30.1 28.1 4117.3 672.0

OWL Price Target

For more insight on analysts targets of OWL, see our OWL price target page. And for a list of of all stocks sorted by upside potential based on analyst target price, see our Top Price Target page.

Average Price Target $17.50 Average Broker Recommendation 1.5 (Moderate Buy)

Blue Owl Capital Inc. (OWL) Company Bio


Blue Owl Capital Inc. operates as an asset management firm. The Company offers direct lending and GP capital solutions. Blue Owl Capital serves customers in the United States.


OWL Latest News Stream


Event/Time News Detail
Loading, please wait...

OWL Latest Social Stream


Loading social stream, please wait...

View Full OWL Social Stream

Latest OWL News From Around the Web

Below are the latest news stories about BLUE OWL CAPITAL INC that investors may wish to consider to help them evaluate OWL as an investment opportunity.

Owl Rock Hosts Investor Day

Owl Rock, a division of Blue Owl Capital Inc. (NYSE: OWL), is hosting an Investor Day today beginning at 9:00 a.m. EDT to provide an in-depth review of the platform's investment strategy and the business development companies it manages, including Owl Rock Capital Corporation (NYSE: ORCC) and several private and non-traded BDCs. The event will feature presentations with senior members of the Owl Rock team, including Chief Executive Officer, Craig W. Packer and Chief Financial Officer, Jonathan L

Yahoo | May 24, 2023

Oppenheimer Says Equity Market Remains Positive Despite Slowing Economy; Here Are 2 Buy-Rated Stocks to Watch Now

The April CPI Consumer Price Index (CPI) report is in and the data showed that headline inflation increased by 0.4% compared to last month and by 4.9% over last April. That represents the slowest annual rate increase since April 2021. While inflation remains high, the deceleration shows the Fed’s aggressive attempts to tame it are working. That is the opinion of John Stoltzfus, Chief Investment Strategist at Oppenheimer, who says the Fed’s efforts “seem to have been the right course of action.”

Yahoo | May 10, 2023

Blue Owl Posts 32% Fee Earnings Growth as Assets Swell

Blue Owl Capital rebounded in the first quarter, posting a net profit as assets under management swelled and fee-related earnings rose 32% to help the firm defy market headwinds as the year began. The New York-based alternative asset manager, best known for its private credit business and for backing other asset managers, said it managed $144.4 billion at the end of March, up 42% from a year earlier, while fee-paying assets rose 40% to $91.6 billion. Despite a challenging fundraising market, the firm said its direct-lending business attracted $26.8 billion over the 12 months through March, increasing the total under management for that strategy by 60% to $71.6 billion and driving the gains in fee-paying assets, according to an earnings presentation.

Yahoo | May 4, 2023

Blue Owl Capital Inc. First Quarter 2023 Results

Blue Owl Capital Inc. (NYSE:OWL) ("Blue Owl") today reported its financial results for the first quarter ended March 31, 2023.

Yahoo | May 4, 2023

Blue Owl Capital Inc. to Announce First Quarter 2023 Results

Blue Owl Capital Inc. (NYSE: OWL) ("Blue Owl") today announced it will release its financial results for the first quarter ended March 31, 2023, on Thursday, May 4, 2023, before market open. Blue Owl invites all interested persons to its webcast / conference call at 8:30 a.m. Eastern Time on May 4 to discuss its results.

Yahoo | April 13, 2023

Read More 'OWL' Stories Here

OWL Price Returns

1-mo 8.00%
3-mo -6.06%
6-mo 0.97%
1-year -8.61%
3-year N/A
5-year N/A
YTD 5.93%
2022 -26.29%
2021 32.17%
2020 N/A
2019 N/A
2018 N/A

OWL Dividends

Ex-Dividend Date Type Payout Amount Change
Loading, please wait...
View Full OWL Dividend History

Get Free Updates

Join thousands of investors who get the latest news, insights and top rated picks from StockNews.com!