
Owlet, Inc. (OWLT): Price and Financial Metrics
OWLT Price/Volume Stats
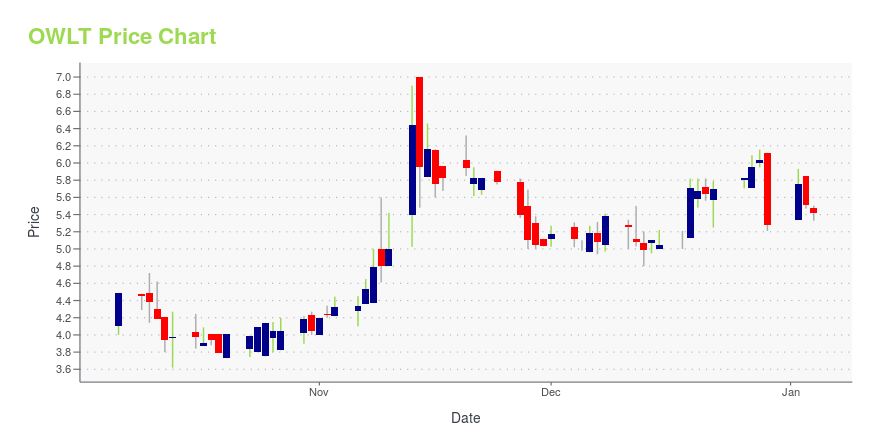
| Current price | $4.39 | 52-week high | $7.50 |
| Prev. close | $4.03 | 52-week low | $3.05 |
| Day low | $4.13 | Volume | 8,500 |
| Day high | $4.44 | Avg. volume | 24,838 |
| 50-day MA | $4.12 | Dividend yield | N/A |
| 200-day MA | $4.68 | Market Cap | 39.94M |
OWLT Stock Price Chart Interactive Chart >
Owlet, Inc. (OWLT) Company Bio
Owlet, Inc. operates a digital parenting platform. Its platform gives parents with real-time data and insights to help parents feel more calm and confident. The company was founded in 2012 and is based in Lehi, Utah.
Latest OWLT News From Around the Web
Below are the latest news stories about OWLET INC that investors may wish to consider to help them evaluate OWLT as an investment opportunity.
Despite Fast-paced Momentum, Owlet, Inc. (OWLT) Is Still a Bargain StockIf you are looking for stocks that have gained strong momentum recently but are still trading at reasonable prices, Owlet, Inc. (OWLT) could be a great choice. It is one of the several stocks that passed through our 'Fast-Paced Momentum at a Bargain' screen. |
Owlet to Participate in BTIG’s Digital Health ForumLEHI, Utah, November 14, 2023--Owlet to Participate in BTIG’s Digital Health Forum |
Owlet Announces Third Quarter 2023 Financial ResultsLEHI, Utah, November 13, 2023--Owlet Announces Third Quarter 2023 Financial Results |
Owlet Achieves De Novo FDA-Clearance For Dream Sock® – The First and Only Over-the-Counter, Medical Grade Pulse Oximeter Cleared for InfantsLEHI, Utah, November 09, 2023--Owlet Achieves De Novo FDA-Clearance For Dream Sock® – The First and Only Over-the-Counter, Medical Grade Pulse Oximeter Cleared for Infants |
Owlet to Report Third Quarter 2023 Financial Results on November 13, 2023LEHI, Utah, November 01, 2023--Owlet to Report Third Quarter 2023 Financial Results on November 13, 2023 |
OWLT Price Returns
| 1-mo | 17.69% |
| 3-mo | 5.53% |
| 6-mo | -26.59% |
| 1-year | -8.54% |
| 3-year | -96.67% |
| 5-year | N/A |
| YTD | -16.86% |
| 2023 | -32.54% |
| 2022 | -79.06% |
| 2021 | -73.75% |
| 2020 | N/A |
| 2019 | N/A |
Loading social stream, please wait...