
Oxford Square Capital Corp. - Closed End Fund (OXSQ): Price and Financial Metrics
OXSQ Price/Volume Stats
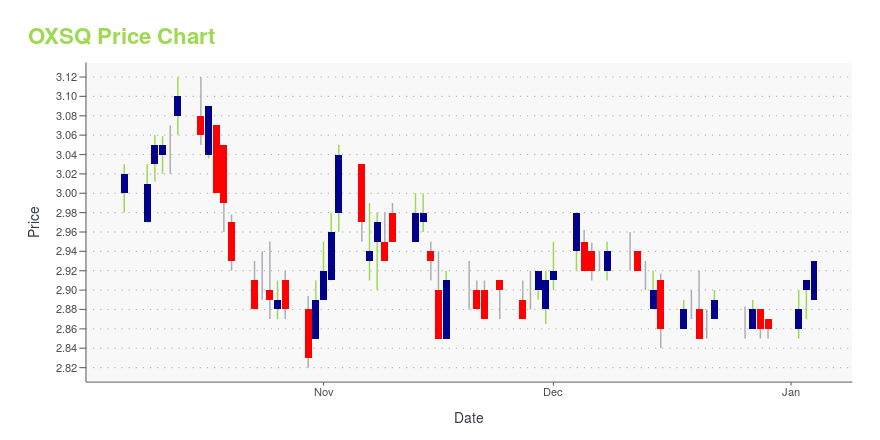
| Current price | $2.98 | 52-week high | $3.29 |
| Prev. close | $2.98 | 52-week low | $2.82 |
| Day low | $2.97 | Volume | 211,000 |
| Day high | $3.00 | Avg. volume | 258,287 |
| 50-day MA | $3.03 | Dividend yield | 14% |
| 200-day MA | $3.03 | Market Cap | 177.97M |
OXSQ Stock Price Chart Interactive Chart >
Oxford Square Capital Corp. - Closed End Fund (OXSQ) Company Bio
Oxford Square Capital Corp. (formerly TICC Capital Corp.), a business development company, operates as a closed-end, non-diversified management investment company. The firm invests in both public and private companies. The company was founded in 2003 and is based in Greenwich, Connecticut.
Latest OXSQ News From Around the Web
Below are the latest news stories about OXFORD SQUARE CAPITAL CORP that investors may wish to consider to help them evaluate OXSQ as an investment opportunity.
Oxford Square Capital Corp. Reports Mixed Q3 Results and Announces Upcoming DistributionsFinancial Performance and Future Payouts Detailed for Investors |
Oxford Square Capital Corp. (NASDAQ:OXSQ) Q3 2023 Earnings Call TranscriptOxford Square Capital Corp. (NASDAQ:OXSQ) Q3 2023 Earnings Call Transcript November 7, 2023 Oxford Square Capital Corp. reports earnings inline with expectations. Reported EPS is $0.12 EPS, expectations were $0.12. Operator: Good morning, ladies and gentlemen. Welcome to the Oxford Square Capital Corp. Third Quarter 2023 Earnings Conference Call. My name is Jo Peter [ph]. […] |
Oxford Square Capital Corp. Announces Net Asset Value and Selected Financial Results for the Quarter Ended September 30, 2023 and Declaration of Distributions on Common Stock for the Months Ending January 31, February 29, and March 31, 2024GREENWICH, Conn., Nov. 07, 2023 (GLOBE NEWSWIRE) -- Oxford Square Capital Corp. (NasdaqGS: OXSQ) (NasdaqGS: OXSQL) (NasdaqGS: OXSQZ) (NasdaqGS: OXSQG) (the “Company,” “we,” “us” or “our”) announced today its financial results and related information for the quarter ended September 30, 2023. On November 2, 2023, our Board of Directors declared the following distributions on our common stock: Month EndingRecord DatePayment DateAmount Per ShareJanuary 31, 2024January 17, 2024January 31, 2024$0.035F |
Oxford Square Capital Corp. Schedules Third Quarter 2023 Earnings Release and Conference Call for November 7, 2023Greenwich, Conn., Nov. 02, 2023 (GLOBE NEWSWIRE) -- Oxford Square Capital Corp. (NasdaqGS: OXSQ) (NasdaqGS: OXSQL) (NasdaqGS: OXSQZ) (NasdaqGS: OXSQG) announced today that it will hold a conference call to discuss third quarter 2023 earnings on Tuesday, November 7, 2023 at 9:00 AM Eastern time. The toll free dial-in number is 1-833-470-1428, access code number 495860. There will be a recording available for 30 days after the call. If you are interested in hearing the recording, please dial 1-866 |
Oxford Square Capital Corp's Dividend AnalysisOxford Square Capital Corp (NASDAQ:OXSQ) recently announced a dividend of $0.04 per share, payable on 2023-11-30, with the ex-dividend date set for 2023-11-15. As investors look forward to this upcoming payment, the spotlight also shines on the company's dividend history, yield, and growth rates. Using the data from GuruFocus, let's delve into Oxford Square Capital Corp's dividend performance and assess its sustainability. |
OXSQ Price Returns
| 1-mo | 2.52% |
| 3-mo | -3.66% |
| 6-mo | 4.50% |
| 1-year | 17.63% |
| 3-year | -4.73% |
| 5-year | -10.75% |
| YTD | 12.74% |
| 2023 | 9.20% |
| 2022 | -14.38% |
| 2021 | 47.13% |
| 2020 | -32.37% |
| 2019 | -5.32% |
OXSQ Dividends
| Ex-Dividend Date | Type | Payout Amount | Change | ||||||
|---|---|---|---|---|---|---|---|---|---|
| Loading, please wait... | |||||||||
Continue Researching OXSQ
Want to do more research on Oxford Square Capital Corp's stock and its price? Try the links below:Oxford Square Capital Corp (OXSQ) Stock Price | Nasdaq
Oxford Square Capital Corp (OXSQ) Stock Quote, History and News - Yahoo Finance
Oxford Square Capital Corp (OXSQ) Stock Price and Basic Information | MarketWatch
Loading social stream, please wait...