Occidental Petroleum Corporation (OXY): Price and Financial Metrics
OXY Price/Volume Stats
Current price | $65.60 | 52-week high | $76.11 |
Prev. close | $63.15 | 52-week low | $55.51 |
Day low | $64.15 | Volume | 11,679,000 |
Day high | $65.91 | Avg. volume | 11,256,852 |
50-day MA | $63.56 | Dividend yield | 1.14% |
200-day MA | $61.75 | Market Cap | 58.04B |
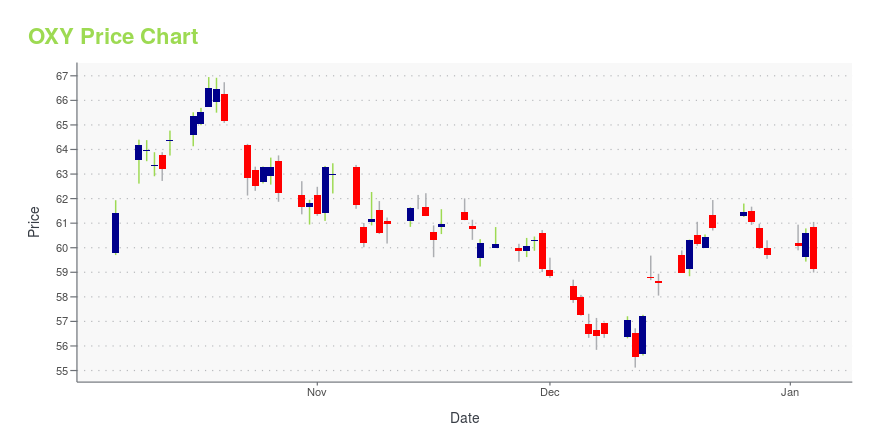
OXY Stock Price Chart Interactive Chart >
OXY POWR Grades
- OXY scores best on the Quality dimension, with a Quality rank ahead of 72.42% of US stocks.
- The strongest trend for OXY is in Quality, which has been heading down over the past 177 days.
- OXY ranks lowest in Growth; there it ranks in the 4th percentile.
OXY Stock Summary
- OXY has a higher market value than 96.01% of US stocks; more precisely, its current market capitalization is $55,637,643,936.
- OCCIDENTAL PETROLEUM CORP's stock had its IPO on January 1, 1986, making it an older stock than 93.16% of US equities in our set.
- In terms of volatility of its share price, OXY is more volatile than merely 3.9% of stocks we're observing.
- Stocks with similar financial metrics, market capitalization, and price volatility to OCCIDENTAL PETROLEUM CORP are PCAR, DD, IFF, VALE, and TEVA.
- Visit OXY's SEC page to see the company's official filings. To visit the company's web site, go to www.oxy.com.
OXY Valuation Summary
- In comparison to the median Energy stock, OXY's price/sales ratio is 35.71% higher, now standing at 1.9.
- OXY's price/earnings ratio has moved up 0.8 over the prior 243 months.
Below are key valuation metrics over time for OXY.
Stock | Date | P/S | P/B | P/E | EV/EBIT |
---|---|---|---|---|---|
OXY | 2023-09-14 | 1.9 | 2.0 | 10.2 | 7.9 |
OXY | 2023-09-13 | 1.8 | 2.0 | 10.0 | 7.8 |
OXY | 2023-09-12 | 1.8 | 2.0 | 10.0 | 7.8 |
OXY | 2023-09-11 | 1.8 | 1.9 | 9.6 | 7.6 |
OXY | 2023-09-08 | 1.8 | 2.0 | 9.9 | 7.7 |
OXY | 2023-09-07 | 1.8 | 2.0 | 9.7 | 7.6 |
OXY Growth Metrics
- Its year over year revenue growth rate is now at 94.67%.
- Its 3 year net cashflow from operations growth rate is now at 67.76%.
- The 4 year net income to common stockholders growth rate now stands at -619.25%.

The table below shows OXY's growth in key financial areas (numbers in millions of US dollars).
Date | Revenue | Operating Cash Flow | Net Income to Common Stock |
---|---|---|---|
2022-12-31 | 37,095 | 16,810 | 12,504 |
2022-09-30 | 36,779 | 15,927 | 12,114 |
2022-06-30 | 34,093 | 14,778 | 10,196 |
2022-03-31 | 29,368 | 12,763 | 6,544 |
2021-12-31 | 26,314 | 10,434 | 1,522 |
2021-09-30 | 21,652 | 8,746 | -1,127 |
OXY's Quality Factors
The “Quality” component of the POWR Ratings focuses on 31 different factors of a companies fundamentals and operational strength. Here are some key insights as we drill into the specifics of these quality attributes.- OXY has a Quality Grade of C, ranking ahead of 66.1% of graded US stocks.
- OXY's asset turnover comes in at 0.224 -- ranking 100th of 136 Petroleum and Natural Gas stocks.
- KWR, DK, and GTE are the stocks whose asset turnover ratios are most correlated with OXY.
The table below shows OXY's key quality metrics over time.
Period | Asset Turnover | Gross Margin | ROIC |
---|---|---|---|
2021-06-30 | 0.224 | 0.031 | -0.036 |
2021-03-31 | 0.181 | -0.105 | -0.123 |
2020-12-31 | 0.183 | -0.057 | -0.134 |
2020-09-30 | 0.203 | 0.075 | -0.126 |
2020-06-30 | 0.208 | 0.173 | -0.092 |
2020-03-31 | 0.248 | 0.268 | -0.014 |
OXY Price Target
For more insight on analysts targets of OXY, see our OXY price target page. And for a list of of all stocks sorted by upside potential based on analyst target price, see our Top Price Target page.
Average Price Target | $34.40 | Average Broker Recommendation | 1.76 (Moderate Buy) |
Occidental Petroleum Corporation (OXY) Company Bio
Occidental Petroleum engages in the acquisition, exploration, and development of oil and gas properties in the United States and internationally. The company was founded in 1920 and is based in Houston, Texas.
Latest OXY News From Around the Web
Below are the latest news stories about OCCIDENTAL PETROLEUM CORP that investors may wish to consider to help them evaluate OXY as an investment opportunity.
It’s Not Too Late To Jump On The Energy Bull MarketIn June, West Texas Intermediate crude oil traded in the mid-$60s. Three months later, it’s pushing $95 per barrel, with market expectations that it will soon be above $100. |
Occidental Petroleum Corporation's (NYSE:OXY) Stock Is Going Strong: Is the Market Following Fundamentals?Occidental Petroleum's (NYSE:OXY) stock is up by a considerable 12% over the past three months. Given the company's... |
3 Stocks Delivering $2.8 Billion in Dividends to Warren Buffett Each YearJust three Warren Buffett dividend stocks account for nearly half of all the dividend payments Berkshire Hathaway will receive in 2023. |
Occidental Petroleum (OXY) Gains As Market Dips: What You Should KnowOccidental Petroleum (OXY) closed at $62.89 in the latest trading session, marking a +0.53% move from the prior day. |
7 Warren Buffett Stocks That Should Be On Every Investor’s Radar This FallEach time Buffett buys or sells a stock, it makes news headlines. |
OXY Price Returns
1-mo | 5.42% |
3-mo | 11.87% |
6-mo | 5.68% |
1-year | 7.97% |
3-year | 546.53% |
5-year | -9.27% |
YTD | 5.05% |
2022 | 119.10% |
2021 | 67.71% |
2020 | -56.63% |
2019 | -28.28% |
2018 | -13.05% |
OXY Dividends
Ex-Dividend Date | Type | Payout Amount | Change | ||||||
---|---|---|---|---|---|---|---|---|---|
Loading, please wait... |
Continue Researching OXY
Here are a few links from around the web to help you further your research on Occidental Petroleum Corp's stock as an investment opportunity:Occidental Petroleum Corp (OXY) Stock Price | Nasdaq
Occidental Petroleum Corp (OXY) Stock Quote, History and News - Yahoo Finance
Occidental Petroleum Corp (OXY) Stock Price and Basic Information | MarketWatch
Loading social stream, please wait...