
Pan American Silver Corp. (PAAS): Price and Financial Metrics
PAAS Price/Volume Stats
| Current price | $21.47 | 52-week high | $24.27 |
| Prev. close | $21.41 | 52-week low | $12.16 |
| Day low | $21.22 | Volume | 2,117,768 |
| Day high | $21.79 | Avg. volume | 4,331,188 |
| 50-day MA | $21.36 | Dividend yield | 1.75% |
| 200-day MA | $16.83 | Market Cap | 7.79B |
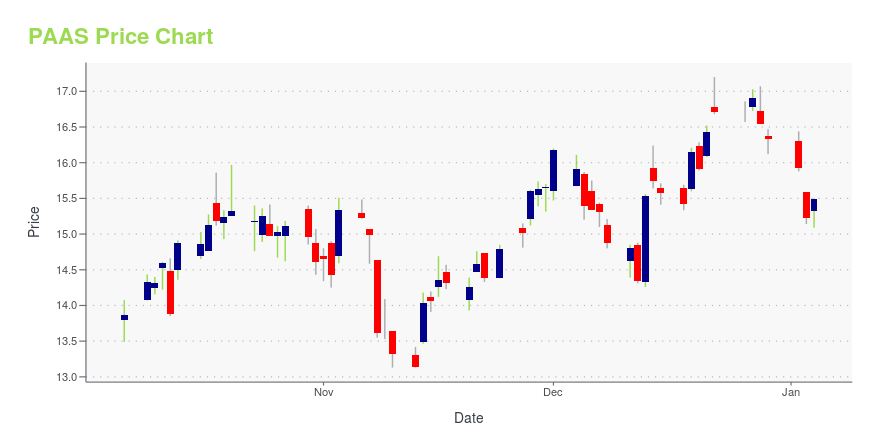
PAAS Stock Price Chart Interactive Chart >
Pan American Silver Corp. (PAAS) Company Bio
Pan American Silver operates and develops, and explores for silver producing properties and assets in Mexico, Peru, Argentina, and Bolivia. The company was founded in 1979 and is based in Vancouver, Canada.
Latest PAAS News From Around the Web
Below are the latest news stories about PAN AMERICAN SILVER CORP that investors may wish to consider to help them evaluate PAAS as an investment opportunity.
Top 3 Basic Materials Stock Picks for the New YearBasic materials stocks should have a great 2024 as the dollar falls, the economy performs well, and decarbonization efforts continue. |
15 Biggest Silver Mining Companies in the WorldThis article will list the world’s top silver mining companies and highlight the recent trends in the silver industry. You can skip our detailed overview of supply and demand intricacies of silver and read 5 Biggest Silver Mining Companies in the World. Global Silver Demand and Supply In 2022, the dynamics of global silver demand and […] |
Pan American Announces Preliminary Economic Assessment of the La Colorada Skarn ProjectVANCOUVER, British Columbia, December 19, 2023--Pan American Silver Corp. (NYSE: PAAS) (TSX: PAAS) ("Pan American" or the "Company") announces the results of a preliminary economic assessment ("PEA") of its 100% owned, long-life La Colorada Skarn project in Zacatecas, Mexico. |
13 Most Promising Gold Stocks According to AnalystsIn this article, we discuss the 13 most promising gold stocks according to analysts. To skip the detailed analysis of the industry, go directly to the 5 Most Promising Gold Stocks According to Analysts. Gold has started to make noise in the stock and commodity markets again as it recently jumped to a record high. […] |
12 Best Gold Stocks With DividendsIn this article, we will take a detailed look at the 12 Best Gold Stocks With Dividends. For a quick overview of such stocks, read our article 5 Best Gold Stocks With Dividends. As investors look to 2024 for new market dynamics where the Fed is expected to begin cutting interest rates, gold investors are assessing the situation and […] |
PAAS Price Returns
| 1-mo | 6.71% |
| 3-mo | 13.40% |
| 6-mo | 56.55% |
| 1-year | 41.55% |
| 3-year | -14.43% |
| 5-year | 48.42% |
| YTD | 33.16% |
| 2023 | 2.50% |
| 2022 | -33.00% |
| 2021 | -27.08% |
| 2020 | 46.84% |
| 2019 | 63.86% |
PAAS Dividends
| Ex-Dividend Date | Type | Payout Amount | Change | ||||||
|---|---|---|---|---|---|---|---|---|---|
| Loading, please wait... | |||||||||
Continue Researching PAAS
Want to see what other sources are saying about Pan American Silver Corp's financials and stock price? Try the links below:Pan American Silver Corp (PAAS) Stock Price | Nasdaq
Pan American Silver Corp (PAAS) Stock Quote, History and News - Yahoo Finance
Pan American Silver Corp (PAAS) Stock Price and Basic Information | MarketWatch
Loading social stream, please wait...