Pacific Biosciences of California, Inc. (PACB): Price and Financial Metrics
GET POWR RATINGS... FREE!
PACB POWR Grades
- Growth is the dimension where PACB ranks best; there it ranks ahead of 55.21% of US stocks.
- The strongest trend for PACB is in Momentum, which has been heading down over the past 179 days.
- PACB's current lowest rank is in the Stability metric (where it is better than 9.22% of US stocks).
PACB Stock Summary
- With a one year PEG ratio of 1.28, Pacific Biosciences Of California Inc is expected to have a higher PEG ratio (a measure of how expensive a stock is relative to its expected earnings growth) than just 6.4% of US stocks.
- With a year-over-year growth in debt of 2,170.88%, Pacific Biosciences Of California Inc's debt growth rate surpasses 99.2% of about US stocks.
- In terms of twelve month growth in earnings before interest and taxes, Pacific Biosciences Of California Inc is reporting a growth rate of -984.2%; that's higher than merely 2.2% of US stocks.
- Stocks that are quantitatively similar to PACB, based on their financial statements, market capitalization, and price volatility, are MODN, WATT, GWRE, EB, and AI.
- PACB's SEC filings can be seen here. And to visit Pacific Biosciences Of California Inc's official web site, go to www.pacb.com.
PACB Valuation Summary
- PACB's price/sales ratio is 58.9; this is 1450% higher than that of the median Healthcare stock.
- Over the past 132 months, PACB's price/sales ratio has gone down 570.5.
Below are key valuation metrics over time for PACB.
Stock | Date | P/S | P/B | P/E | EV/EBIT |
---|---|---|---|---|---|
PACB | 2021-08-31 | 58.9 | 24.1 | -80.7 | -93.4 |
PACB | 2021-08-30 | 57.3 | 23.5 | -78.5 | -91.0 |
PACB | 2021-08-27 | 56.6 | 23.2 | -77.5 | -90.0 |
PACB | 2021-08-26 | 53.8 | 22.0 | -73.7 | -85.9 |
PACB | 2021-08-25 | 54.7 | 22.4 | -75.0 | -87.2 |
PACB | 2021-08-24 | 55.7 | 22.8 | -76.3 | -88.6 |
PACB Growth Metrics
- Its 5 year cash and equivalents growth rate is now at 242.94%.
- Its 2 year price growth rate is now at 26.49%.
- Its year over year cash and equivalents growth rate is now at 1255.22%.

The table below shows PACB's growth in key financial areas (numbers in millions of US dollars).
Date | Revenue | Operating Cash Flow | Net Income to Common Stock |
---|---|---|---|
2021-12-31 | 130.513 | -111.18 | -181.223 |
2021-09-30 | 121.63 | -93.735 | -36.959 |
2021-06-30 | 105.825 | -70.887 | -77.209 |
2021-03-31 | 92.292 | -78.964 | -59.294 |
2020-12-31 | 78.893 | 19.503 | 29.403 |
2020-09-30 | 79.687 | 15.586 | -45.623 |
PACB's Quality Factors
The “Quality” component of the POWR Ratings focuses on 31 different factors of a companies fundamentals and operational strength. Here are some key insights as we drill into the specifics of these quality attributes.- PACB has a Quality Grade of C, ranking ahead of 52.82% of graded US stocks.
- PACB's asset turnover comes in at 0.132 -- ranking 67th of 75 Measuring and Control Equipment stocks.
- TMO, PKI, and PRPO are the stocks whose asset turnover ratios are most correlated with PACB.
The table below shows PACB's key quality metrics over time.
Period | Asset Turnover | Gross Margin | ROIC |
---|---|---|---|
2021-06-30 | 0.132 | 0.427 | -0.085 |
2021-03-31 | 0.169 | 0.412 | -0.129 |
2020-12-31 | 0.271 | 0.413 | 0.185 |
2020-09-30 | 0.355 | 0.428 | -0.409 |
2020-06-30 | 0.445 | 0.411 | -0.473 |
2020-03-31 | 0.515 | 0.410 | -0.412 |
PACB Price Target
For more insight on analysts targets of PACB, see our PACB price target page. And for a list of of all stocks sorted by upside potential based on analyst target price, see our Top Price Target page.
Average Price Target | $45.75 | Average Broker Recommendation | 1.6 (Moderate Buy) |
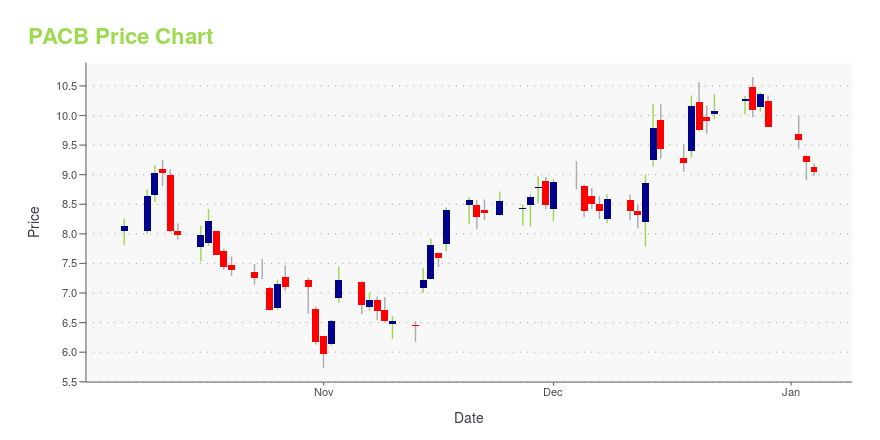
PACB Stock Price Chart Interactive Chart >
PACB Price/Volume Stats
Current price | $5.73 | 52-week high | $36.36 |
Prev. close | $5.51 | 52-week low | $4.51 |
Day low | $5.46 | Volume | 5,075,591 |
Day high | $5.94 | Avg. volume | 6,076,605 |
50-day MA | $8.13 | Dividend yield | N/A |
200-day MA | $18.53 | Market Cap | 1.29B |
Pacific Biosciences of California, Inc. (PACB) Company Bio
Pacific Biosciences of California, Inc. designs, develops, manufactures, and markets an integrated platform for genetic analysis. The company was formerly known as Nanofluidics, Inc. The company was founded in 2000 and is based in Menlo Park, California.
Latest PACB News From Around the Web
Below are the latest news stories about Pacific Biosciences Of California Inc that investors may wish to consider to help them evaluate PACB as an investment opportunity.
10 Genomics Stocks in Cathie Wood’s Portfolio That Are UnderperformingIn this article, we discuss 10 genomics stocks in Cathie Wood’s portfolio that are underperforming. If you want to skip our detailed analysis of these stocks, go directly to 5 Genomics Stocks in Cathie Wood’s Portfolio That Are Underperforming. ARK Investment Management is an innovation-focused hedge fund that is headquartered in St. Petersburg, Florida, with […] |
PacBio Welcomes Dr. Michael Eberle as Vice President of Computational BiologyGenomics Industry Veteran to Oversee Development of Robust Computational Biology ProgramMENLO PARK, Calif., Feb. 23, 2022 (GLOBE NEWSWIRE) -- PacBio (Nasdaq: PACB), a leading developer of high-quality, highly accurate sequencing platforms, welcomes Michael Eberle, Ph.D., as Vice President of Computational Biology. Michael will be responsible for leading the company’s bioinformatics and data sciences program to enhance PacBio’s genomic analysis offerings. Michael is a genomics industry veteran wi |
Pacific Biosciences of California, Inc. (PACB) CEO Christian Henry on Q4 2021 Results - Earnings Call TranscriptPacific Biosciences of California, Inc. (PACB) Q4 2021 Earnings Conference Call February 15, 2022, 16:30 ET Company Participants Todd Friedman - Director, IR Christian Henry - President, CEO & Director Susan Kim - CFO Mark Van Oene - COO Conference Call Participants Kyle Mikson - Canaccord Genuity Tejas Savant -... |
Pacific Biosciences Shares Fall As Q4 Earnings Miss EstimatesPacific Biosciences of California Inc (NASDAQ: PACB ) reported Q4 sales of $36.02 million , +33% Y/Y, missing the consensus of $36.12 million. The company placed 48 Sequel II or IIe instruments in the quarter, bringing the total installed base to 374, compared to 203 a year … Full story available on Benzinga.com |
Pacific Biosciences slips as analysts trim price targets after Q4 2021 earningsPacific Biosciences (PACB) has lost ~10% in the pre-market on Wednesday after several Wall Street analysts slashed their price targets on the life sciences company in reaction to… |
PACB Price Returns
1-mo | N/A |
3-mo | -51.77% |
6-mo | -77.24% |
1-year | -75.50% |
3-year | -20.75% |
5-year | 44.33% |
YTD | -71.99% |
2021 | -21.13% |
2020 | 404.67% |
2019 | -30.54% |
2018 | 180.30% |
2017 | -30.53% |
Continue Researching PACB
Want to see what other sources are saying about Pacific Biosciences Of California Inc's financials and stock price? Try the links below:Pacific Biosciences Of California Inc (PACB) Stock Price | Nasdaq
Pacific Biosciences Of California Inc (PACB) Stock Quote, History and News - Yahoo Finance
Pacific Biosciences Of California Inc (PACB) Stock Price and Basic Information | MarketWatch
Loading social stream, please wait...