
Palo Alto Networks, Inc. (PANW): Price and Financial Metrics
PANW Price/Volume Stats
| Current price | $326.81 | 52-week high | $380.84 |
| Prev. close | $320.13 | 52-week low | $201.17 |
| Day low | $321.27 | Volume | 1,709,187 |
| Day high | $329.16 | Avg. volume | 4,505,489 |
| 50-day MA | $320.92 | Dividend yield | N/A |
| 200-day MA | $299.23 | Market Cap | 105.82B |
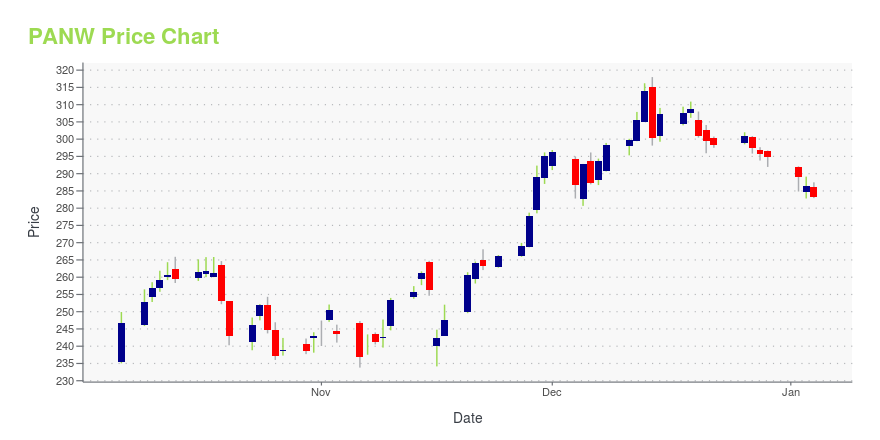
PANW Stock Price Chart Interactive Chart >
Palo Alto Networks, Inc. (PANW) Company Bio
Palo Alto Networks provides enterprise security platform to enterprises, service providers, and government entities worldwide. Its platform includes Next-Generation Firewall that delivers application, user, and content visibility and control, as well as protection against network-based cyber threats, and Threat Intelligence Cloud that offers central intelligence capabilities, as well as automated delivery of preventative measures against cyber attacks. The company was founded in 2005 and is based in Santa Clara, California.
Latest PANW News From Around the Web
Below are the latest news stories about PALO ALTO NETWORKS INC that investors may wish to consider to help them evaluate PANW as an investment opportunity.
2024 Market Predictions: 2 Trends Destined to Crash, One Set to SoarTrends come and go on Wall Street, so two of this years hottest growth opportunities may fall flat next year. |
Dow Jones Futures: Tesla Falls Below Buy Point; Hot IPO Hits Profit-Taking ZoneTesla undercut an early entry while hot tech IPO Arm Holdings moved into a profit-taking zone heading into the final trading day of 2023. |
Midday Movers: AMD Higher on Graphics Card Report, Boeing Falls on Inspection IssueU.S. equities traded marginally higher at midday as the S&P 500 remained in striking distance of its all-time high, with the index en route to its ninth-straight week of gains. The Santa Claus Rally appeared to be materializing, as the Nasdaq edged higher to near its best year since 2003, and the Dow Jones Industrial Average remained above the all-time high closing it set Wednesday. Match Group (MTCH) shares gained as KeyBanc analysts maintained an “overweight” rating on the stock. |
Splunk (SPLK) Up 1% Since Last Earnings Report: Can It Continue?Splunk (SPLK) reported earnings 30 days ago. What's next for the stock? We take a look at earnings estimates for some clues. |
Palo Alto Networks® Closes Talon Cyber Security Acquisition and Will Offer Complimentary Enterprise Browser to Qualified SASE AI CustomersPalo Alto Networks (NASDAQ: PANW), the global cybersecurity leader, today announced that it has completed the acquisition of Talon Cyber Security, a pioneer of enterprise browser technology. |
PANW Price Returns
| 1-mo | 0.48% |
| 3-mo | 12.14% |
| 6-mo | -4.56% |
| 1-year | 33.24% |
| 3-year | 146.64% |
| 5-year | 331.85% |
| YTD | 10.83% |
| 2023 | 111.32% |
| 2022 | -24.81% |
| 2021 | 56.66% |
| 2020 | 53.68% |
| 2019 | 22.78% |
Continue Researching PANW
Here are a few links from around the web to help you further your research on Palo Alto Networks Inc's stock as an investment opportunity:Palo Alto Networks Inc (PANW) Stock Price | Nasdaq
Palo Alto Networks Inc (PANW) Stock Quote, History and News - Yahoo Finance
Palo Alto Networks Inc (PANW) Stock Price and Basic Information | MarketWatch
Loading social stream, please wait...