
PAR Technology Corporation (PAR): Price and Financial Metrics
PAR Price/Volume Stats
| Current price | $53.36 | 52-week high | $55.66 |
| Prev. close | $52.50 | 52-week low | $28.21 |
| Day low | $52.98 | Volume | 231,538 |
| Day high | $54.10 | Avg. volume | 310,834 |
| 50-day MA | $47.20 | Dividend yield | N/A |
| 200-day MA | $42.78 | Market Cap | 1.81B |
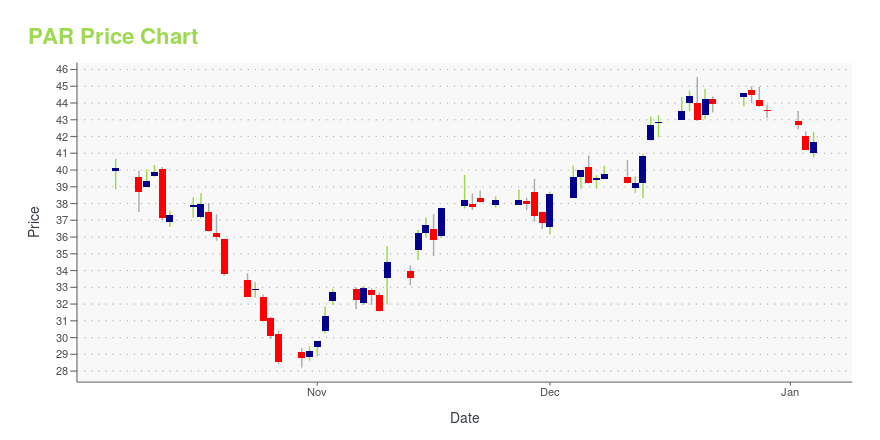
PAR Stock Price Chart Interactive Chart >
PAR Technology Corporation (PAR) Company Bio
PAR Technology Corporation primarily provides technology solutions to businesses and organizations in the hospitality industry worldwide. The company operates in two segments: Hospitality and Government. The company was founded in 1968 and based in New Hartford, New York.
Latest PAR News From Around the Web
Below are the latest news stories about PAR TECHNOLOGY CORP that investors may wish to consider to help them evaluate PAR as an investment opportunity.
7 Short-Squeeze Stocks That Are Screaming for SpeculationWhile the concept of short-squeeze stocks has been all the rage throughout most of the pandemic-disruption cycle, we may have been doing this all wrong. |
4 Stocks to Watch From the Prospering Technology Solutions IndustryIndustry players like IBM HPE, AGYS and PAR are gaining from the increased demand for integrated solutions and the growing adoption of the multi-cloud model, despite persistent supply chain constraints. |
PAR Technology Partners With DoorDash To Create Seamless Ordering EnvironmentNEW HARTFORD, N.Y., December 12, 2023--ParTech, Inc. (PAR), a global restaurant technology company and leader in unified commerce for enterprise restaurants, has partnered with on-demand delivery platform DoorDash. This collaboration is dedicated to advancing the restaurant industry by improving operational efficiency and customer satisfaction, further expanding PAR’s ecosystem to include over 500 integrations, the largest in the industry. |
PAR Technology Corporation Appoints Linda Crawford to its Board of DirectorsNEW HARTFORD, N.Y., December 05, 2023--PAR Technology Corporation (NYSE: PAR) a global restaurant technology company and provider of unified commerce solutions to enterprise restaurants today announced the appointment of Linda Crawford to its Board of Directors effective today, December 5, 2023. |
PAR Technology Recognized for Innovation in Restaurant Technology by Three Leading Awards for Loyalty and Payment CapabilitiesNEW HARTFORD, N.Y., December 01, 2023--ParTech, Inc. (PAR), a global restaurant technology company and provider of unified commerce solutions for enterprise restaurants, today announced that PAR Technology’s Punchh® and PAR Pay solutions have been recognized by MarTech Breakthrough, the Stevie® Awards, and The SaaS Awards. |
PAR Price Returns
| 1-mo | 16.97% |
| 3-mo | 23.40% |
| 6-mo | 11.66% |
| 1-year | 57.96% |
| 3-year | -15.21% |
| 5-year | 108.16% |
| YTD | 22.55% |
| 2023 | 67.01% |
| 2022 | -50.60% |
| 2021 | -15.96% |
| 2020 | 104.26% |
| 2019 | 43.13% |
Continue Researching PAR
Here are a few links from around the web to help you further your research on Par Technology Corp's stock as an investment opportunity:Par Technology Corp (PAR) Stock Price | Nasdaq
Par Technology Corp (PAR) Stock Quote, History and News - Yahoo Finance
Par Technology Corp (PAR) Stock Price and Basic Information | MarketWatch
Loading social stream, please wait...