Par Pacific Holdings, Inc. (PARR): Price and Financial Metrics
GET POWR RATINGS... FREE!
PARR POWR Grades
- Momentum is the dimension where PARR ranks best; there it ranks ahead of 99.65% of US stocks.
- The strongest trend for PARR is in Quality, which has been heading up over the past 177 days.
- PARR's current lowest rank is in the Stability metric (where it is better than 16.51% of US stocks).
PARR Stock Summary
- PAR PACIFIC HOLDINGS INC's capital turnover -- a measure of revenue relative to shareholder's equity -- is better than 97.05% of US listed stocks.
- Of note is the ratio of PAR PACIFIC HOLDINGS INC's sales and general administrative expense to its total operating expenses; just 4.63% of US stocks have a lower such ratio.
- Over the past twelve months, PARR has reported earnings growth of -3,242.91%, putting it ahead of merely 0.55% of US stocks in our set.
- If you're looking for stocks that are quantitatively similar to PAR PACIFIC HOLDINGS INC, a group of peers worth examining would be CAKE, TA, ENLC, CENX, and SGU.
- Visit PARR's SEC page to see the company's official filings. To visit the company's web site, go to www.parpacific.com.
PARR Valuation Summary
- In comparison to the median Energy stock, PARR's price/sales ratio is 82.61% lower, now standing at 0.2.
- Over the past 122 months, PARR's price/sales ratio has gone NA NA.
Below are key valuation metrics over time for PARR.
Stock | Date | P/S | P/B | P/E | EV/EBIT |
---|---|---|---|---|---|
PARR | 2023-03-20 | 0.2 | 2.6 | 4.6 | 6.8 |
PARR | 2023-03-17 | 0.2 | 2.5 | 4.4 | 6.7 |
PARR | 2023-03-16 | 0.2 | 2.5 | 4.4 | 6.7 |
PARR | 2023-03-15 | 0.2 | 2.4 | 4.3 | 6.5 |
PARR | 2023-03-14 | 0.2 | 2.5 | 4.5 | 6.7 |
PARR | 2023-03-13 | 0.2 | 2.5 | 4.4 | 6.6 |
PARR Growth Metrics
- Its 3 year price growth rate is now at -30.71%.
- Its 5 year net cashflow from operations growth rate is now at 1719.1%.
- The year over year price growth rate now stands at 0.07%.

The table below shows PARR's growth in key financial areas (numbers in millions of US dollars).
Date | Revenue | Operating Cash Flow | Net Income to Common Stock |
---|---|---|---|
2022-09-30 | 6,806.426 | 286.837 | 287.556 |
2022-06-30 | 6,060.509 | -1.78 | 101.962 |
2022-03-31 | 5,171.702 | -4.57 | -156.121 |
2021-12-31 | 4,710.089 | -27.622 | -81.297 |
2021-09-30 | 4,132.078 | -8.573 | -221.301 |
2021-06-30 | 3,511.691 | -69.166 | -317.374 |
PARR's Quality Factors
The “Quality” component of the POWR Ratings focuses on 31 different factors of a companies fundamentals and operational strength. Here are some key insights as we drill into the specifics of these quality attributes.- PARR has a Quality Grade of D, ranking ahead of 15% of graded US stocks.
- PARR's asset turnover comes in at 1.489 -- ranking 8th of 137 Petroleum and Natural Gas stocks.
- EOG, BDCO, and CVX are the stocks whose asset turnover ratios are most correlated with PARR.
The table below shows PARR's key quality metrics over time.
Period | Asset Turnover | Gross Margin | ROIC |
---|---|---|---|
2021-06-30 | 1.489 | 0.037 | -0.095 |
2021-03-31 | 1.230 | 0.065 | -0.069 |
2020-12-31 | 1.425 | 0.057 | -0.137 |
2020-09-30 | 1.631 | 0.091 | -0.070 |
2020-06-30 | 1.860 | 0.084 | -0.093 |
2020-03-31 | 2.130 | 0.085 | -0.065 |
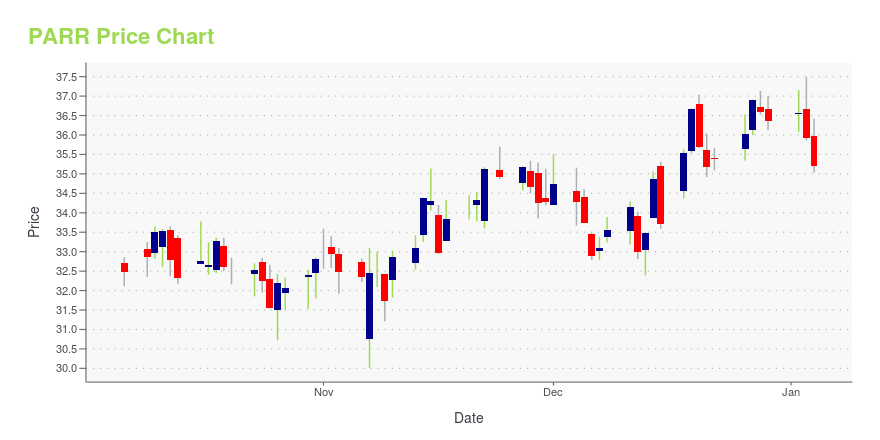
PARR Stock Price Chart Interactive Chart >
PARR Price/Volume Stats
Current price | $29.20 | 52-week high | $29.90 |
Prev. close | $29.11 | 52-week low | $11.99 |
Day low | $28.76 | Volume | 682,800 |
Day high | $29.45 | Avg. volume | 838,285 |
50-day MA | $27.64 | Dividend yield | N/A |
200-day MA | $21.48 | Market Cap | 1.77B |
Par Pacific Holdings, Inc. (PARR) Company Bio
Par Petroleum Corporation operates as a diversified energy company in the United States. It operates through three segments: Refining, Distribution and Marketing; Natural Gas and Oil Operations; and Commodity Marketing and Logistics. The company was formerly known as Delta Petroleum Corporation and changed its name to Par Petroleum Corporation in August 2012. The company was founded in 1984 and is based in Houston, Texas.
Latest PARR News From Around the Web
Below are the latest news stories about PAR PACIFIC HOLDINGS INC that investors may wish to consider to help them evaluate PARR as an investment opportunity.
Marathon (MRO) to Advance Guinea Gas Mega Hub With ChevronMarathon Oil (MRO) affiliate partners with a Chevron company to develop the Equatorial Guinea Regional Gas Mega Hub. This move is expected to have a positive impact on MRO's profits and cash flows. |
Is FREYR Battery (FREY) Outperforming Other Oils-Energy Stocks This Year?Here is how FREYR Battery (FREY) and Par Petroleum (PARR) have performed compared to their sector so far this year. |
3 Stocks to Buy as Oil Prices ReboundOPEC+ has committed to lowering oil production thus cutting supply through the end of the year |
Par Petroleum (PARR) Stock Sinks As Market Gains: What You Should KnowPar Petroleum (PARR) closed the most recent trading day at $29.11, moving -0.34% from the previous trading session. |
Shell's (SHEL) Subsidiary Signs Merger Agreement With VoltaShell (SHEL) subsidiary gets the merger go-ahead from Volta stockholders at a special meeting in exchange for cash of 86 cents per share. |
PARR Price Returns
1-mo | 0.17% |
3-mo | 25.59% |
6-mo | 69.67% |
1-year | 116.62% |
3-year | 347.17% |
5-year | 70.56% |
YTD | 25.59% |
2022 | 40.99% |
2021 | 17.95% |
2020 | -39.85% |
2019 | 63.89% |
2018 | -26.45% |
Continue Researching PARR
Want to do more research on Par Pacific Holdings Inc's stock and its price? Try the links below:Par Pacific Holdings Inc (PARR) Stock Price | Nasdaq
Par Pacific Holdings Inc (PARR) Stock Quote, History and News - Yahoo Finance
Par Pacific Holdings Inc (PARR) Stock Price and Basic Information | MarketWatch
Loading social stream, please wait...