PAVmed Inc. (PAVM): Price and Financial Metrics
PAVM Price/Volume Stats
| Current price | $1.02 | 52-week high | $9.00 |
| Prev. close | $1.04 | 52-week low | $0.60 |
| Day low | $1.01 | Volume | 227,700 |
| Day high | $1.06 | Avg. volume | 66,783 |
| 50-day MA | $1.14 | Dividend yield | N/A |
| 200-day MA | $2.49 | Market Cap | 9.57M |
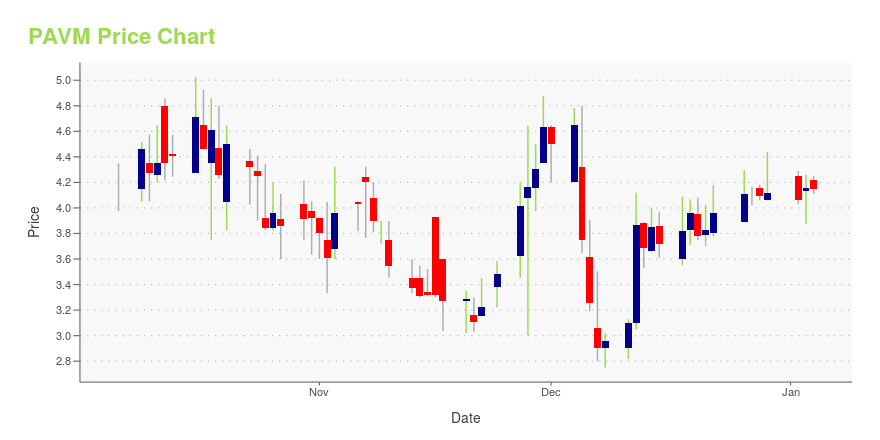
PAVM Stock Price Chart Interactive Chart >
PAVmed Inc. (PAVM) Company Bio
PAVmed Inc. operates as a medical device company in the United States. Its product pipeline includes PortIO, a long-term implantable vascular access device; CarpX, a percutaneous device to treat carpal tunnel syndrome; NextCath, a self-anchoring catheter; DisappEAR: Antibiotic-eluting resorbable ear tube; NextFlo, a disposable infusion pump; and Caldus, a disposable tissue ablation device. The company was formerly known as PAXmed Inc. and changed its name to PAVmed Inc. in April 2015. PAVmed Inc. was founded in 2014 and is based in New York, New York.
Latest PAVM News From Around the Web
Below are the latest news stories about PAVMED INC that investors may wish to consider to help them evaluate PAVM as an investment opportunity.
The 3 Most Undervalued Penny Stocks to Buy in DecemberWhen economies are set to boom, undervalued penny stocks typically lead the way when it comes to equity rallies. |
Lucid Diagnostics Announces Peer-Reviewed Publication of Positive Results from Three Clinical Utility StudiesLucid Diagnostics Inc. (Nasdaq: LUCD) ("Lucid" or the "Company") a commercial-stage, cancer prevention medical diagnostics company, and majority-owned subsidiary of PAVmed Inc. (Nasdaq: PAVM, PAVMZ) ( "PAVmed"), today announced that three manuscripts providing interim results from the Prospective REView of Esophageal Precancer DetectioN in AT-Risk Patients (PREVENT) Registry, the CLinical Utility of EsoGuard (CLUE) study, and full data from the San Antonio Firefighter study, have been published— |
PAVmed Provides Additional Details for Upcoming Stock Dividend to ShareholdersPAVmed Inc. (Nasdaq: PAVM, PAVMZ) ("PAVmed" or the "Company"), a diversified commercial-stage medical technology company, operating in the medical device, diagnostics, and digital health sectors today provided additional details on the previously announced dividend of common stock of its majority-owned subsidiary, Lucid Diagnostics Inc. (Nasdaq: LUCD) for PAVmed shareholders. |
Penny Stock Jackpots: 3 High-Stakes Picks With 10-Bagger PotentialThere are penny stocks and then are penny stock picks that are so outrageously wild that they should never be considered unless one is gambling with pocket change. |
PAVmed Announces Dividend of Lucid Diagnostics Common Stock and Reverse Stock SplitPAVmed Inc. (Nasdaq: PAVM, PAVMZ) ("PAVmed" or the "Company"), a diversified commercial-stage medical technology company, operating in the medical device, diagnostics, and digital health sectors today announced a dividend of approximately 3.3 million shares of common stock of its majority-owned subsidiary, Lucid Diagnostics Inc. (Nasdaq: LUCD), which equals the number of shares PAVmed will receive in the contemporaneous partial settlement of outstanding intercompany debt owed to PAVmed by Lucid. |
PAVM Price Returns
| 1-mo | 33.04% |
| 3-mo | -40.70% |
| 6-mo | -58.20% |
| 1-year | -81.79% |
| 3-year | -99.01% |
| 5-year | -93.46% |
| YTD | -75.24% |
| 2023 | -42.78% |
| 2022 | -80.49% |
| 2021 | 16.04% |
| 2020 | 76.67% |
| 2019 | 24.74% |


Loading social stream, please wait...