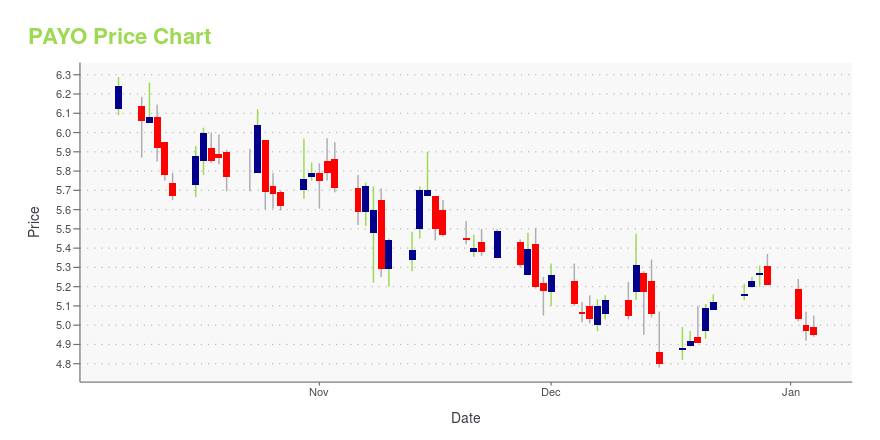
Payoneer Global Inc. (PAYO): Price and Financial Metrics
PAYO Price/Volume Stats
| Current price | $7.47 | 52-week high | $11.29 |
| Prev. close | $7.31 | 52-week low | $4.69 |
| Day low | $7.21 | Volume | 1,902,900 |
| Day high | $7.48 | Avg. volume | 3,211,874 |
| 50-day MA | $9.08 | Dividend yield | N/A |
| 200-day MA | $8.27 | Market Cap | 2.69B |
PAYO Stock Price Chart Interactive Chart >
Payoneer Global Inc. (PAYO) Company Bio
Payoneer Inc. operates a cross-border payment and commerce-enabling platform that facilitates digital businesses, online sellers, and freelancers worldwide to receive and manage their international payments. The company delivers a suite of services that includes cross-border payments, working capital, tax solutions, merchant services, and risk management. Its platform offers freelancers to pay and get paid by companies and marketplaces worldwide; web development companies and service providers with options to pay and get paid by companies and marketplace worldwide; and a solution for online advertisers, affiliates, publishers, and content creators a way to get paid by digital marketing platforms. The company also provides its platform for online sellers to receive payments from eCommerce marketplaces to one consolidated account; monitor performance of multiple stores at a common place; pay suppliers and contractors; access funds directly to local bank account; view upcoming payments and payment history for eCommerce sites; and receive payments for items purchased in stores. In addition, it offers working capital services. Payoneer Inc. was founded in 2005 and is based in New York, New York with additional offices in the United States and internationally.
PAYO Price Returns
| 1-mo | -12.63% |
| 3-mo | N/A |
| 6-mo | -2.61% |
| 1-year | 52.76% |
| 3-year | 66.00% |
| 5-year | N/A |
| YTD | -25.60% |
| 2024 | 92.71% |
| 2023 | -4.75% |
| 2022 | -25.58% |
| 2021 | N/A |
| 2020 | N/A |


Loading social stream, please wait...