Paysign, Inc. (PAYS): Price and Financial Metrics
GET POWR RATINGS... FREE!
PAYS POWR Grades
- PAYS scores best on the Growth dimension, with a Growth rank ahead of 91.36% of US stocks.
- PAYS's strongest trending metric is Growth; it's been moving up over the last 179 days.
- PAYS ranks lowest in Sentiment; there it ranks in the 23rd percentile.
PAYS Stock Summary
- Paysign Inc's market capitalization of $106,841,760 is ahead of only 15.62% of US-listed equities.
- For PAYS, its debt to operating expenses ratio is greater than that reported by merely 21.1% of US equities we're observing.
- Equity multiplier, or assets relative to shareholders' equity, comes in at 6.63 for Paysign Inc; that's greater than it is for 84.01% of US stocks.
- Stocks with similar financial metrics, market capitalization, and price volatility to Paysign Inc are CIDM, NCSM, UGRO, PRPO, and HURN.
- Visit PAYS's SEC page to see the company's official filings. To visit the company's web site, go to www.paysign.com.
PAYS Valuation Summary
- In comparison to the median Industrials stock, PAYS's price/sales ratio is 96.97% higher, now standing at 6.5.
- PAYS's price/sales ratio has moved up 6.3 over the prior 142 months.
- PAYS's price/earnings ratio has moved down 2.7 over the prior 142 months.
Below are key valuation metrics over time for PAYS.
Stock | Date | P/S | P/B | P/E | EV/EBIT |
---|---|---|---|---|---|
PAYS | 2021-08-26 | 6.5 | 10.9 | -10.0 | -5.3 |
PAYS | 2021-08-25 | 6.4 | 10.7 | -9.8 | -5.1 |
PAYS | 2021-08-24 | 6.7 | 11.1 | -10.2 | -5.6 |
PAYS | 2021-08-23 | 6.6 | 11.0 | -10.1 | -5.5 |
PAYS | 2021-08-20 | 6.5 | 10.8 | -10.0 | -5.3 |
PAYS | 2021-08-19 | 6.5 | 10.8 | -10.0 | -5.3 |
PAYS Growth Metrics
- Its 3 year price growth rate is now at 4575%.
- Its 2 year net income to common stockholders growth rate is now at 342.87%.
- The year over year price growth rate now stands at -60.62%.

The table below shows PAYS's growth in key financial areas (numbers in millions of US dollars).
Date | Revenue | Operating Cash Flow | Net Income to Common Stock |
---|---|---|---|
2021-12-31 | 29.46485 | 15.22819 | -2.721334 |
2021-09-30 | 27.95134 | 17.22861 | -7.137658 |
2021-06-30 | 20.03161 | 27.09362 | -13.01879 |
2021-03-31 | 19.82339 | 12.93129 | -12.30605 |
2020-12-31 | 24.12043 | 13.77582 | -9.141562 |
2020-09-30 | 26.63197 | 18.49347 | -2.946625 |
PAYS's Quality Factors
The “Quality” component of the POWR Ratings focuses on 31 different factors of a companies fundamentals and operational strength. Here are some key insights as we drill into the specifics of these quality attributes.- PAYS has a Quality Grade of C, ranking ahead of 25.06% of graded US stocks.
- PAYS's asset turnover comes in at 0.266 -- ranking 457th of 561 Business Services stocks.
- MANH, SGRP, and VRNS are the stocks whose asset turnover ratios are most correlated with PAYS.
The table below shows PAYS's key quality metrics over time.
Period | Asset Turnover | Gross Margin | ROIC |
---|---|---|---|
2021-06-30 | 0.266 | 0.313 | 0.263 |
2021-03-31 | 0.285 | 0.324 | 0.320 |
2020-12-31 | 0.365 | 0.386 | 0.253 |
2020-09-30 | 0.426 | 0.400 | 0.199 |
2020-06-30 | 0.632 | 0.544 | -0.164 |
2020-03-31 | 0.694 | 0.558 | -0.215 |
PAYS Price Target
For more insight on analysts targets of PAYS, see our PAYS price target page. And for a list of of all stocks sorted by upside potential based on analyst target price, see our Top Price Target page.
Average Price Target | $4.42 | Average Broker Recommendation | 1.5 (Moderate Buy) |
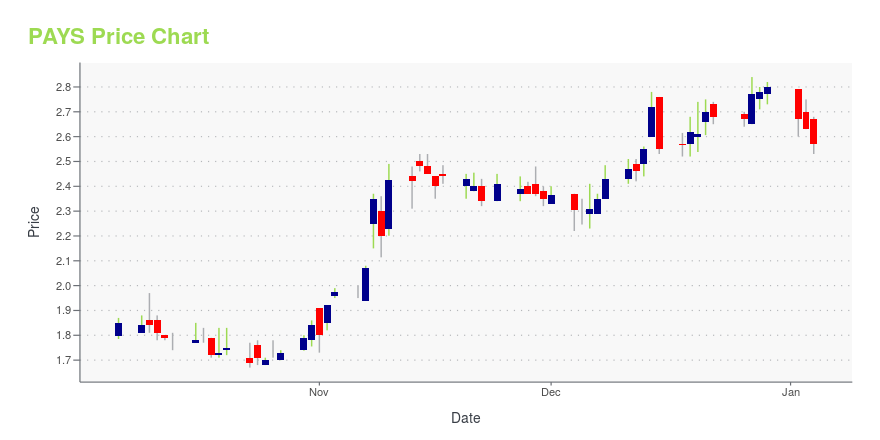
PAYS Stock Price Chart Interactive Chart >
PAYS Price/Volume Stats
Current price | $1.45 | 52-week high | $3.88 |
Prev. close | $1.34 | 52-week low | $1.15 |
Day low | $1.28 | Volume | 152,787 |
Day high | $1.48 | Avg. volume | 189,970 |
50-day MA | $1.90 | Dividend yield | N/A |
200-day MA | $2.18 | Market Cap | 75.40M |
Paysign, Inc. (PAYS) Company Bio
Paysign, Inc. provides payment services. The Company develops and manages payment solutions, prepaid card programs, and customized payment services. Paysign serves customers worldwide.
Latest PAYS News From Around the Web
Below are the latest news stories about Paysign Inc that investors may wish to consider to help them evaluate PAYS as an investment opportunity.
Investors Buy High Volume of PaySign Put Options (NASDAQ:PAYS)PaySign, Inc. (NASDAQ:PAYS) was the target of unusually large options trading on Tuesday. Traders bought 4,712 put options on the stock. This represents an increase of approximately 774% compared to the typical daily volume of 539 put options. In other PaySign news, CEO Mark Newcomer sold 38,828 shares of the stock in a transaction that [] |
PaySign, Inc. (NASDAQ:PAYS) Sees Significant Increase in Short InterestPaySign, Inc. (NASDAQ:PAYS) was the target of a significant increase in short interest in November. As of November 30th, there was short interest totalling 719,800 shares, an increase of 21.8% from the November 15th total of 591,200 shares. Currently, 2.3% of the shares of the stock are sold short. Based on an average daily trading [] |
State Street Corp Trims Position in PaySign, Inc. (NASDAQ:PAYS)State Street Corp decreased its position in shares of PaySign, Inc. (NASDAQ:PAYS) by 80.4% during the 2nd quarter, HoldingsChannel.com reports. The institutional investor owned 101,484 shares of the companys stock after selling 415,154 shares during the quarter. State Street Corps holdings in PaySign were worth $323,000 at the end of the most recent quarter. Several [] |
Price T Rowe Associates Inc. MD Purchases 9,342 Shares of PaySign, Inc. (NASDAQ:PAYS)Price T Rowe Associates Inc. MD grew its stake in PaySign, Inc. (NASDAQ:PAYS) by 38.7% in the 2nd quarter, Holdings Channel.com reports. The fund owned 33,500 shares of the companys stock after purchasing an additional 9,342 shares during the quarter. Price T Rowe Associates Inc. MDs holdings in PaySign were worth $107,000 as of its [] |
7 Penny Stocks With the Potential to 10X in 2022The broader market looks expensive, but these penny stocks provide low-cost opportunities for considerable upside according to analysts. |
PAYS Price Returns
1-mo | N/A |
3-mo | -40.33% |
6-mo | -26.77% |
1-year | -54.26% |
3-year | -83.29% |
5-year | 208.51% |
YTD | -9.38% |
2021 | -65.52% |
2020 | -54.29% |
2019 | 188.35% |
2018 | 385.52% |
2017 | 117.07% |
Loading social stream, please wait...