Paychex Inc. (PAYX): Price and Financial Metrics
PAYX Price/Volume Stats
Current price | $122.80 | 52-week high | $129.70 |
Prev. close | $121.53 | 52-week low | $104.09 |
Day low | $121.85 | Volume | 1,618,300 |
Day high | $122.97 | Avg. volume | 1,678,003 |
50-day MA | $121.94 | Dividend yield | 2.99% |
200-day MA | $119.55 | Market Cap | 44.19B |
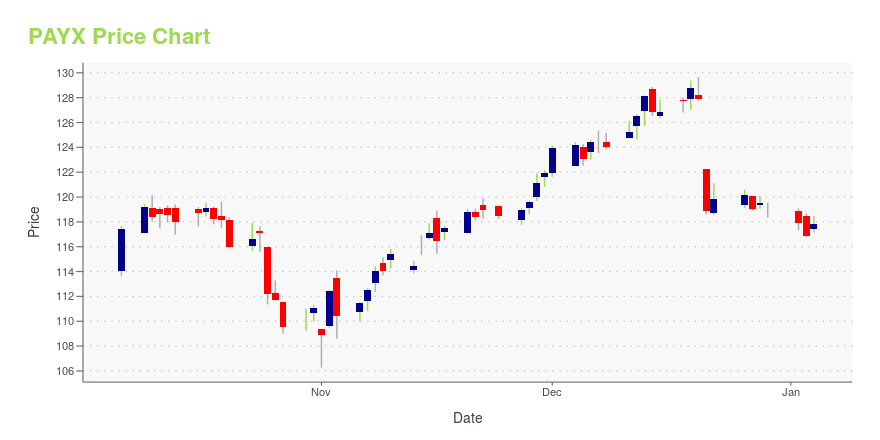
PAYX Stock Price Chart Interactive Chart >
PAYX POWR Grades
- PAYX scores best on the Quality dimension, with a Quality rank ahead of 97.32% of US stocks.
- PAYX's strongest trending metric is Growth; it's been moving down over the last 26 weeks.
- PAYX ranks lowest in Sentiment; there it ranks in the 10th percentile.
PAYX Stock Summary
- PAYCHEX INC's market capitalization of $42,041,582,150 is ahead of 93.84% of US-listed equities.
- PAYCHEX INC's stock had its IPO on November 7, 1988, making it an older stock than 89.35% of US equities in our set.
- The volatility of PAYCHEX INC's share price is greater than that of merely 7.27% US stocks with at least 200 days of trading history.
- If you're looking for stocks that are quantitatively similar to PAYCHEX INC, a group of peers worth examining would be HSY, ROST, GWW, CRH, and AME.
- PAYX's SEC filings can be seen here. And to visit PAYCHEX INC's official web site, go to www.paychex.com.
PAYX Valuation Summary
- PAYX's price/sales ratio is 8.3; this is 295.24% higher than that of the median Industrials stock.
- PAYX's price/sales ratio has moved down 3.3 over the prior 243 months.
Below are key valuation metrics over time for PAYX.
Stock | Date | P/S | P/B | P/E | EV/EBIT |
---|---|---|---|---|---|
PAYX | 2023-12-29 | 8.3 | 12.2 | 26.3 | 19.7 |
PAYX | 2023-12-28 | 8.3 | 12.2 | 26.4 | 19.8 |
PAYX | 2023-12-27 | 8.3 | 12.2 | 26.3 | 19.7 |
PAYX | 2023-12-26 | 8.4 | 12.3 | 26.5 | 19.9 |
PAYX | 2023-12-22 | 8.4 | 12.2 | 26.5 | 19.8 |
PAYX | 2023-12-21 | 8.3 | 12.1 | 26.3 | 19.7 |
PAYX Growth Metrics
- Its 3 year net income to common stockholders growth rate is now at 31.66%.
- The 2 year net income to common stockholders growth rate now stands at 22.71%.
- Its 3 year cash and equivalents growth rate is now at -57.76%.
The table below shows PAYX's growth in key financial areas (numbers in millions of US dollars).
Date | Revenue | Operating Cash Flow | Net Income to Common Stock |
---|---|---|---|
2022-12-31 | 4,816.8 | 1,636 | 1,466.6 |
2022-09-30 | 4,735 | 1,484.2 | 1,438.4 |
2022-06-30 | 4,611.7 | 1,505.5 | 1,392.8 |
2022-03-31 | 4,496.6 | 1,558 | 1,359.4 |
2021-12-31 | 4,332.3 | 1,385 | 1,279.2 |
2021-09-30 | 4,207.5 | 1,430.9 | 1,219.5 |
PAYX's Quality Factors
The “Quality” component of the POWR Ratings focuses on 31 different factors of a companies fundamentals and operational strength. Here are some key insights as we drill into the specifics of these quality attributes.- PAYX has a Quality Grade of A, ranking ahead of 96.92% of graded US stocks.
- PAYX's asset turnover comes in at 0.456 -- ranking 342nd of 563 Business Services stocks.
- JCI, EGHT, and ADS are the stocks whose asset turnover ratios are most correlated with PAYX.
The table below shows PAYX's key quality metrics over time.
Period | Asset Turnover | Gross Margin | ROIC |
---|---|---|---|
2021-08-31 | 0.456 | 0.697 | 0.740 |
2021-05-31 | 0.452 | 0.687 | 0.667 |
2021-02-28 | 0.448 | 0.684 | 0.649 |
2020-11-30 | 0.454 | 0.683 | 0.666 |
2020-08-31 | 0.454 | 0.683 | 0.681 |
2020-05-31 | 0.457 | 0.683 | 0.720 |
PAYX Price Target
For more insight on analysts targets of PAYX, see our PAYX price target page. And for a list of of all stocks sorted by upside potential based on analyst target price, see our Top Price Target page.
Average Price Target | $108.86 | Average Broker Recommendation | 2.02 (Hold) |
Paychex Inc. (PAYX) Company Bio
Paychex, Inc. is an American provider of human resource, payroll, and benefits outsourcing services for small- to medium-sized businesses. With headquarters in Rochester, New York, the company has more than 100 offices serving approximately 670,000 payroll clients in the U.S. and Europe. In 2019, Paychex ranked in position 700 on the Fortune 500 list of largest corporations by revenue, and the company's revenue for fiscal year 2020 is projected to exceed $4.1 billion. (Source:Wikipedia)
Latest PAYX News From Around the Web
Below are the latest news stories about PAYCHEX INC that investors may wish to consider to help them evaluate PAYX as an investment opportunity.
BBSI vs. PAYX: Which Stock Should Value Investors Buy Now?BBSI vs. PAYX: Which Stock Is the Better Value Option? |
Paychex, Inc. (NASDAQ:PAYX) Q2 2024 Earnings Call TranscriptPaychex, Inc. (NASDAQ:PAYX) Q2 2024 Earnings Call Transcript December 21, 2023 Paychex, Inc. beats earnings expectations. Reported EPS is $1.08, expectations were $1.07. PAYX isn’t one of the 30 most popular stocks among hedge funds at the end of the third quarter (see the details here). Operator: Good day, everyone, and welcome to today’s Paychex […] |
Paychex (PAYX) Q2 Earnings Beat on Solid Segmental PerformancePaychex (PAYX) benefits from record-level client retention and a strong pipeline for its services. |
Nike downgraded, Waste Management upgraded: Wall Street's top analyst callsNike downgraded, Waste Management upgraded: Wall Street's top analyst calls |
Paychex Second Quarter 2024 Earnings: In Line With ExpectationsPaychex ( NASDAQ:PAYX ) Second Quarter 2024 Results Key Financial Results Revenue: US$1.26b (up 5.7% from 2Q 2023). Net... |
PAYX Price Returns
1-mo | 0.32% |
3-mo | 3.85% |
6-mo | 8.09% |
1-year | 11.51% |
3-year | 34.13% |
5-year | 76.62% |
YTD | 3.85% |
2023 | 6.21% |
2022 | -13.16% |
2021 | 50.16% |
2020 | 13.25% |
2019 | 34.53% |
PAYX Dividends
Ex-Dividend Date | Type | Payout Amount | Change | ||||||
---|---|---|---|---|---|---|---|---|---|
Loading, please wait... |
Continue Researching PAYX
Want to do more research on Paychex Inc's stock and its price? Try the links below:Paychex Inc (PAYX) Stock Price | Nasdaq
Paychex Inc (PAYX) Stock Quote, History and News - Yahoo Finance
Paychex Inc (PAYX) Stock Price and Basic Information | MarketWatch
Loading social stream, please wait...