Paychex Inc. (PAYX): Price and Financial Metrics
GET POWR RATINGS... FREE!
PAYX POWR Grades
- PAYX scores best on the Quality dimension, with a Quality rank ahead of 97.98% of US stocks.
- The strongest trend for PAYX is in Quality, which has been heading down over the past 177 days.
- PAYX ranks lowest in Value; there it ranks in the 19th percentile.
PAYX Stock Summary
- PAYCHEX INC's market capitalization of $39,233,179,084 is ahead of 94.38% of US-listed equities.
- PAYX's went public 34.41 years ago, making it older than 90.14% of listed US stocks we're tracking.
- The volatility of PAYCHEX INC's share price is greater than that of just 8.47% US stocks with at least 200 days of trading history.
- Stocks that are quantitatively similar to PAYX, based on their financial statements, market capitalization, and price volatility, are LULU, CTAS, TT, DHI, and CRH.
- Visit PAYX's SEC page to see the company's official filings. To visit the company's web site, go to www.paychex.com.
PAYX Valuation Summary
- PAYX's price/sales ratio is 8; this is 627.27% higher than that of the median Industrials stock.
- PAYX's price/earnings ratio has moved down 10.1 over the prior 243 months.
Below are key valuation metrics over time for PAYX.
Stock | Date | P/S | P/B | P/E | EV/EBIT |
---|---|---|---|---|---|
PAYX | 2023-03-17 | 8.0 | 12.1 | 26.4 | 20.1 |
PAYX | 2023-03-16 | 8.1 | 12.2 | 26.7 | 20.4 |
PAYX | 2023-03-15 | 8.0 | 12.0 | 26.3 | 20.0 |
PAYX | 2023-03-14 | 8.1 | 12.2 | 26.6 | 20.3 |
PAYX | 2023-03-13 | 8.1 | 12.2 | 26.6 | 20.3 |
PAYX | 2023-03-10 | 8.1 | 12.1 | 26.5 | 20.2 |
PAYX Growth Metrics
- Its 3 year net income to common stockholders growth rate is now at 31.66%.
- The 2 year net income to common stockholders growth rate now stands at 22.71%.
- Its 3 year cash and equivalents growth rate is now at -57.76%.

The table below shows PAYX's growth in key financial areas (numbers in millions of US dollars).
Date | Revenue | Operating Cash Flow | Net Income to Common Stock |
---|---|---|---|
2022-12-31 | 4,816.8 | 1,636 | 1,466.6 |
2022-09-30 | 4,735 | 1,484.2 | 1,438.4 |
2022-06-30 | 4,611.7 | 1,505.5 | 1,392.8 |
2022-03-31 | 4,496.6 | 1,558 | 1,359.4 |
2021-12-31 | 4,332.3 | 1,385 | 1,279.2 |
2021-09-30 | 4,207.5 | 1,430.9 | 1,219.5 |
PAYX's Quality Factors
The “Quality” component of the POWR Ratings focuses on 31 different factors of a companies fundamentals and operational strength. Here are some key insights as we drill into the specifics of these quality attributes.- PAYX has a Quality Grade of A, ranking ahead of 96.92% of graded US stocks.
- PAYX's asset turnover comes in at 0.456 -- ranking 342nd of 563 Business Services stocks.
- JCI, EGHT, and ADS are the stocks whose asset turnover ratios are most correlated with PAYX.
The table below shows PAYX's key quality metrics over time.
Period | Asset Turnover | Gross Margin | ROIC |
---|---|---|---|
2021-08-31 | 0.456 | 0.697 | 0.740 |
2021-05-31 | 0.452 | 0.687 | 0.667 |
2021-02-28 | 0.448 | 0.684 | 0.649 |
2020-11-30 | 0.454 | 0.683 | 0.666 |
2020-08-31 | 0.454 | 0.683 | 0.681 |
2020-05-31 | 0.457 | 0.683 | 0.720 |
PAYX Price Target
For more insight on analysts targets of PAYX, see our PAYX price target page. And for a list of of all stocks sorted by upside potential based on analyst target price, see our Top Price Target page.
Average Price Target | $108.86 | Average Broker Recommendation | 2.02 (Hold) |
PAYX Stock Price Chart Interactive Chart >
PAYX Price/Volume Stats
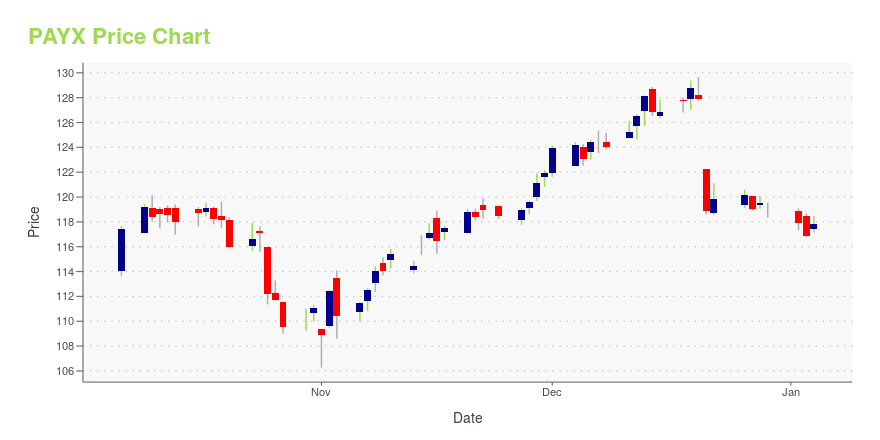
Current price | $113.54 | 52-week high | $141.92 |
Prev. close | $116.03 | 52-week low | $105.66 |
Day low | $113.29 | Volume | 2,497,500 |
Day high | $117.93 | Avg. volume | 1,827,346 |
50-day MA | $112.88 | Dividend yield | 2.9% |
200-day MA | $118.24 | Market Cap | 40.93B |
Paychex Inc. (PAYX) Company Bio
Paychex, Inc. is an American provider of human resource, payroll, and benefits outsourcing services for small- to medium-sized businesses. With headquarters in Rochester, New York, the company has more than 100 offices serving approximately 670,000 payroll clients in the U.S. and Europe. In 2019, Paychex ranked in position 700 on the Fortune 500 list of largest corporations by revenue, and the company's revenue for fiscal year 2020 is projected to exceed $4.1 billion. (Source:Wikipedia)
Latest PAYX News From Around the Web
Below are the latest news stories about PAYCHEX INC that investors may wish to consider to help them evaluate PAYX as an investment opportunity.
Paychex (PAYX) Q3 Earnings & Revenues Beat, Adjusts FY23 ViewPaychex's (PAYX) third-quarter fiscal 2023 earnings and revenues increase year over year. |
14 Best Affordable Tech Stocks to Buy NowIn this article, we take a look at 14 best affordable tech stocks to buy now. If you want to see more best affordable tech stocks to buy now, go directly to 5 Best Affordable Tech Stocks to Buy Now. If a stock is priced at $100 per share or even $200 a share, more […] |
Paychex Q3 Highlights: 8% Revenue Growth, Earnings Beat, Updated Outlook & MorePaychex, Inc (NASDAQ: PAYX) reported third-quarter FY23 revenue growth of 8% year-over-year to $1.38 billion, beating the consensus of $1.36 billion. Total service revenue grew 7% Y/Y to $1.35 billion. Segments: Management Solutions revenue grew 7% Y/Y to $1 billion. PEO and Insurance Solutions' revenue rose 6% Y/Y to $321.2 million. Operating income increased by 9% Y/Y to $611.9 million, and the margin was 44.3%, up 20 bps. Adjusted EPS increased 12% Y/Y to $1.29, beating the consensus of $1.24 |
Paychex Named Among FORTUNE's Most Innovative CompaniesPaychex, Inc., a leading provider of integrated human capital management software solutions for human resources, payroll, benefits, and insurance services, has been recognized on FORTUNE® magazine's inaugural list of America's Most Innovative Companies. The recognition as a 2023 innovator was awarded to Paychex for the company's commitment to industry-leading HR solutions while fostering a culture of innovation. The list, presented by FORTUNE and Statista, Inc., features 300 top-scoring U.S.-bas |
Paychex (PAYX) Beats Q3 Earnings and Revenue EstimatesPaychex (PAYX) delivered earnings and revenue surprises of 4.03% and 1.48%, respectively, for the quarter ended February 2023. Do the numbers hold clues to what lies ahead for the stock? |
PAYX Price Returns
1-mo | 2.57% |
3-mo | -1.09% |
6-mo | 2.57% |
1-year | -14.59% |
3-year | 96.10% |
5-year | 113.32% |
YTD | -1.09% |
2022 | -13.16% |
2021 | 50.16% |
2020 | 13.25% |
2019 | 34.53% |
2018 | -1.08% |
PAYX Dividends
Ex-Dividend Date | Type | Payout Amount | Change | ||||||
---|---|---|---|---|---|---|---|---|---|
Loading, please wait... |
Continue Researching PAYX
Want to do more research on Paychex Inc's stock and its price? Try the links below:Paychex Inc (PAYX) Stock Price | Nasdaq
Paychex Inc (PAYX) Stock Quote, History and News - Yahoo Finance
Paychex Inc (PAYX) Stock Price and Basic Information | MarketWatch
Loading social stream, please wait...