PBF Energy Inc. (PBF): Price and Financial Metrics
GET POWR RATINGS... FREE!
PBF POWR Grades
- Value is the dimension where PBF ranks best; there it ranks ahead of 93.24% of US stocks.
- PBF's strongest trending metric is Growth; it's been moving up over the last 179 days.
- PBF's current lowest rank is in the Stability metric (where it is better than 6.98% of US stocks).
PBF Stock Summary
- The capital turnover (annual revenue relative to shareholder's equity) for PBF is 14.15 -- better than 97.99% of US stocks.
- For PBF, its debt to operating expenses ratio is greater than that reported by 96.17% of US equities we're observing.
- PBF's price/sales ratio is 0.1; that's higher than the P/S ratio of merely 0.97% of US stocks.
- If you're looking for stocks that are quantitatively similar to PBF Energy Inc, a group of peers worth examining would be LXU, TRN, INVA, HTGC, and VGR.
- PBF's SEC filings can be seen here. And to visit PBF Energy Inc's official web site, go to www.pbfenergy.com.
PBF Valuation Summary
- PBF's EV/EBIT ratio is -29.6; this is 263.09% lower than that of the median Energy stock.
- PBF's price/sales ratio has moved up 0.1 over the prior 106 months.
Below are key valuation metrics over time for PBF.
Stock | Date | P/S | P/B | P/E | EV/EBIT |
---|---|---|---|---|---|
PBF | 2021-09-03 | 0.1 | 0.7 | -1.6 | -29.6 |
PBF | 2021-09-02 | 0.1 | 0.7 | -1.7 | -29.8 |
PBF | 2021-09-01 | 0.1 | 0.7 | -1.6 | -29.7 |
PBF | 2021-08-31 | 0.1 | 0.8 | -1.8 | -30.2 |
PBF | 2021-08-30 | 0.1 | 0.7 | -1.8 | -30.2 |
PBF | 2021-08-27 | 0.1 | 0.8 | -1.9 | -30.6 |
PBF Growth Metrics
- Its year over year revenue growth rate is now at -39.91%.
- Its 2 year revenue growth rate is now at 7.6%.
- Its 4 year price growth rate is now at -69.14%.

The table below shows PBF's growth in key financial areas (numbers in millions of US dollars).
Date | Revenue | Operating Cash Flow | Net Income to Common Stock |
---|---|---|---|
2021-12-31 | 27,253.4 | 477.3 | 231 |
2021-09-30 | 22,664.5 | 486.7 | -232.7 |
2021-06-30 | 19,145.3 | 61.9 | -709 |
2021-03-31 | 14,763.2 | -409.5 | -367.8 |
2020-12-31 | 15,115.9 | -631.6 | -1,392.4 |
2020-09-30 | 17,762.3 | -291.3 | -1,041 |
PBF's Quality Factors
The “Quality” component of the POWR Ratings focuses on 31 different factors of a companies fundamentals and operational strength. Here are some key insights as we drill into the specifics of these quality attributes.- PBF has a Quality Grade of C, ranking ahead of 52.98% of graded US stocks.
- PBF's asset turnover comes in at 2.003 -- ranking 3rd of 136 Petroleum and Natural Gas stocks.
- VLO, HAL, and PTEN are the stocks whose asset turnover ratios are most correlated with PBF.
The table below shows PBF's key quality metrics over time.
Period | Asset Turnover | Gross Margin | ROIC |
---|---|---|---|
2021-09-30 | 2.003 | 0.014 | 0.009 |
2021-06-30 | 1.756 | -0.008 | -0.014 |
2021-03-31 | 1.405 | -0.011 | 0.024 |
2020-12-31 | 1.515 | -0.108 | -0.098 |
2020-09-30 | 1.844 | -0.068 | -0.076 |
2020-06-30 | 2.204 | -0.035 | -0.059 |
PBF Price Target
For more insight on analysts targets of PBF, see our PBF price target page. And for a list of of all stocks sorted by upside potential based on analyst target price, see our Top Price Target page.
Average Price Target | $10.00 | Average Broker Recommendation | 2.28 (Moderate Sell) |
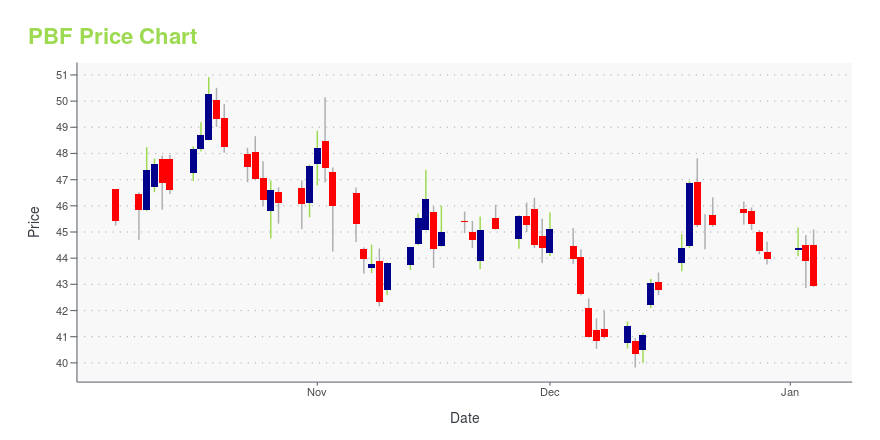
PBF Stock Price Chart Interactive Chart >
PBF Price/Volume Stats
Current price | $31.42 | 52-week high | $32.41 |
Prev. close | $30.41 | 52-week low | $7.24 |
Day low | $30.44 | Volume | 993,244 |
Day high | $31.79 | Avg. volume | 3,457,264 |
50-day MA | $27.06 | Dividend yield | N/A |
200-day MA | $17.54 | Market Cap | 3.80B |
PBF Energy Inc. (PBF) Company Bio
PBF Energy engages in the refining and supply of petroleum products. The company was founded in 2008 and is based in Parsippany, New Jersey.
Latest PBF News From Around the Web
Below are the latest news stories about PBF Energy Inc that investors may wish to consider to help them evaluate PBF as an investment opportunity.
PBF Energy to Participate in Industry ConferencesPBF Energy Inc. (NYSE:PBF) today announced that members of its management team will participate in the Credit Suisse Annual Energy Summit on March 1, 2022 and the Bank of America Refining Conference on March 10, 2022. |
PBF Energy: Bullish on Post-Pandemic RecoveryPBF Energy (PBF) reported historically high revenues for Q4 2021 and a higher demand for its refined oil products post pandemic. PBF Energy is one of the largest oil refinery companies in the United States and operates six large refineries. The company’s stock has been on a one-year uptrend and is currently tempting its 52-week high. I rate the company as bullish. Current Operations PBF Energy refines crude oil and sells unbranded fuels, oils, feedstocks, and lubricants. Its products include gasoline, diesel, jet fuel, heating oil, and engine oil. The company receives crude through various logistics, including pipelines, and has another series of logistics to redistribute the refined products. |
PBF Energy (PBF) Q4 Earnings Beat on Strong Refining MarginHigher contributions from the Refining and Logistics segments aid PBF Energy's (PBF) Q4 earnings. |
PBF Energy (PBF) Q4 Earnings and Revenues Top EstimatesPBF Energy (PBF) delivered earnings and revenue surprises of 85.51% and 13.89%, respectively, for the quarter ended December 2021. Do the numbers hold clues to what lies ahead for the stock? |
PBF Energy Reports Fourth Quarter 2021 ResultsPBF Energy Inc. (NYSE:PBF) today reported fourth quarter 2021 income from operations of $291.1 million as compared to loss from operations of $328.1 million for the fourth quarter of 2020. Excluding special items, fourth quarter 2021 income from operations was $294.5 million as compared to loss from operations of $499.3 million for the fourth quarter of 2020. PBF Energy's financial results reflect the consolidation of PBF Logistics LP (NYSE: PBFX), a master limited partnership of which PBF indir |
PBF Price Returns
1-mo | 21.92% |
3-mo | 79.13% |
6-mo | 156.91% |
1-year | 111.01% |
3-year | 13.27% |
5-year | 73.72% |
YTD | 142.25% |
2021 | 82.68% |
2020 | -77.12% |
2019 | 0.16% |
2018 | -4.93% |
2017 | 33.64% |
Continue Researching PBF
Want to do more research on PBF Energy Inc's stock and its price? Try the links below:PBF Energy Inc (PBF) Stock Price | Nasdaq
PBF Energy Inc (PBF) Stock Quote, History and News - Yahoo Finance
PBF Energy Inc (PBF) Stock Price and Basic Information | MarketWatch
Loading social stream, please wait...