
Pacira BioSciences, Inc. (PCRX): Price and Financial Metrics
PCRX Price/Volume Stats
| Current price | $20.03 | 52-week high | $40.16 |
| Prev. close | $19.98 | 52-week low | $19.34 |
| Day low | $19.94 | Volume | 973,328 |
| Day high | $20.58 | Avg. volume | 760,141 |
| 50-day MA | $26.28 | Dividend yield | N/A |
| 200-day MA | $28.68 | Market Cap | 932.32M |
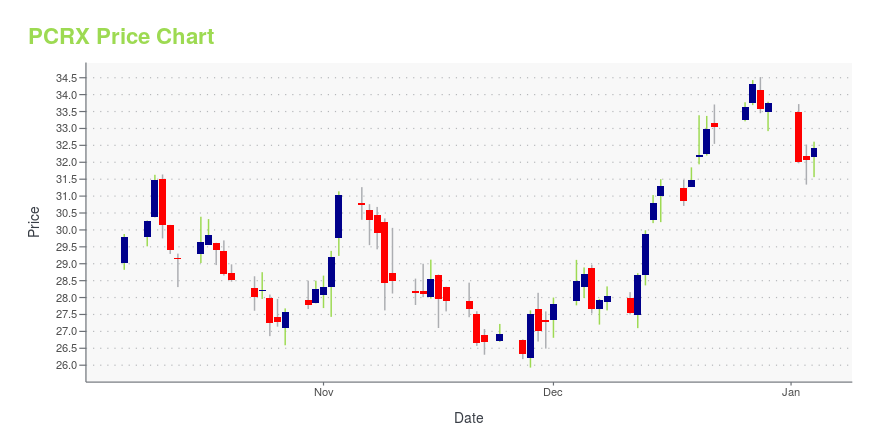
PCRX Stock Price Chart Interactive Chart >
Pacira BioSciences, Inc. (PCRX) Company Bio
Pacira Pharmaceuticals develops, commercializes, and manufactures proprietary pharmaceutical products primarily for use in hospitals and ambulatory surgery centers in the United States. The company was founded in 2006 and is based in Parsippany, New Jersey.
Latest PCRX News From Around the Web
Below are the latest news stories about PACIRA BIOSCIENCES INC that investors may wish to consider to help them evaluate PCRX as an investment opportunity.
Pacira Appoints Frank D. Lee as Chief Executive Officer-- Transformational Leader Brings Three Decades of Global Experience in Pharmaceutical and Biotechnology Product Development and Commercialization -- -- Paul J. Hastings Named Chair of the Board -- -- Dave Stack to Remain in Advisory Role through August 2025 -- TAMPA, Fla., Dec. 21, 2023 (GLOBE NEWSWIRE) -- Pacira BioSciences, Inc. (Nasdaq: PCRX), the industry leader in its commitment to non-opioid pain management and regenerative health solutions, today announced that its Board of Directors (th |
Hedge Funds are Betting on These 14 Sliding StocksIn this article, we will take a look at the hedge funds that are betting on these 14 sliding stocks. To see more such companies, go directly to Hedge Funds are Betting on These 5 Sliding Stocks. Stocks jumped on December 6 after the release of yet another welcome data point for the Federal Reserve, […] |
Pacira (PCRX) Gets FDA Nod for Exparel's Label ExpansionThe FDA approves Pacira's (PCRX) supplemental new drug application to expand the label of Exparel to include both sciatic and femoral nerve blocks. |
Pacira Announces FDA Approval of Expanded EXPAREL Label to Include Two Additional Nerve Block Indications— EXPAREL is the only FDA-approved single-dose regional analgesic to safely demonstrate four days of superiority versus bupivacaine in two clinical studies — — New indications for use as an adductor canal block and sciatic nerve block in the popliteal fossa will significantly extend reach within more than 3 million lower extremity procedures — TAMPA, Fla., Nov. 10, 2023 (GLOBE NEWSWIRE) -- Pacira BioSciences, Inc. (NASDAQ: PCRX), the industry leader in its commitment to non-opioid pain managemen |
Pacira BioSciences to Participate in Fireside Chat at Two Healthcare Conferences in NovemberTAMPA, Fla., Nov. 07, 2023 (GLOBE NEWSWIRE) -- Pacira BioSciences, Inc. (NASDAQ: PCRX) today announced that it will participate in an analyst-led fireside chat at the following two healthcare conferences: Jefferies London Healthcare Conference on Tuesday, November 14th at 11:00AM GMT (6:00AM ET).35th Annual Piper Sandler Healthcare Conference on Tuesday, November 28th at 2:00PM ET. Live audio of the events can be accessed by visiting the “Events” page of the company’s website at investor.pacira. |
PCRX Price Returns
| 1-mo | -27.45% |
| 3-mo | -23.93% |
| 6-mo | -37.50% |
| 1-year | -44.56% |
| 3-year | -66.22% |
| 5-year | -54.45% |
| YTD | -40.63% |
| 2023 | -12.61% |
| 2022 | -35.83% |
| 2021 | 0.55% |
| 2020 | 32.10% |
| 2019 | 5.30% |
Continue Researching PCRX
Want to see what other sources are saying about Pacira BioSciences Inc's financials and stock price? Try the links below:Pacira BioSciences Inc (PCRX) Stock Price | Nasdaq
Pacira BioSciences Inc (PCRX) Stock Quote, History and News - Yahoo Finance
Pacira BioSciences Inc (PCRX) Stock Price and Basic Information | MarketWatch
Loading social stream, please wait...