Paylocity Holding Corporation (PCTY): Price and Financial Metrics
GET POWR RATINGS... FREE!
PCTY POWR Grades
- PCTY scores best on the Sentiment dimension, with a Sentiment rank ahead of 84.08% of US stocks.
- PCTY's strongest trending metric is Stability; it's been moving down over the last 179 days.
- PCTY's current lowest rank is in the Value metric (where it is better than 19.27% of US stocks).
PCTY Stock Summary
- With a one year PEG ratio of 3,403, Paylocity Holding Corp is expected to have a higher PEG ratio (a measure of how expensive a stock is relative to its expected earnings growth) than 98.83% of US stocks.
- With a price/earnings ratio of 130.52, Paylocity Holding Corp P/E ratio is greater than that of about 95.2% of stocks in our set with positive earnings.
- Price to trailing twelve month operating cash flow for PCTY is currently 88.47, higher than 94.7% of US stocks with positive operating cash flow.
- If you're looking for stocks that are quantitatively similar to Paylocity Holding Corp, a group of peers worth examining would be TYL, BLFS, ZEN, YEXT, and TDOC.
- Visit PCTY's SEC page to see the company's official filings. To visit the company's web site, go to www.paylocity.com.
PCTY Valuation Summary
- In comparison to the median Technology stock, PCTY's price/earnings ratio is 434.1% higher, now standing at 208.3.
- Over the past 91 months, PCTY's price/sales ratio has gone up 8.
Below are key valuation metrics over time for PCTY.
Stock | Date | P/S | P/B | P/E | EV/EBIT |
---|---|---|---|---|---|
PCTY | 2021-09-01 | 23.2 | 30.9 | 208.3 | 256.0 |
PCTY | 2021-08-31 | 23.1 | 30.8 | 207.6 | 255.0 |
PCTY | 2021-08-30 | 23.1 | 30.8 | 207.3 | 254.8 |
PCTY | 2021-08-27 | 22.8 | 30.3 | 204.2 | 250.9 |
PCTY | 2021-08-26 | 22.1 | 29.4 | 198.0 | 243.2 |
PCTY | 2021-08-25 | 22.3 | 29.7 | 200.1 | 245.8 |
PCTY Growth Metrics
- The 2 year net income to common stockholders growth rate now stands at 92.1%.
- Its year over year price growth rate is now at 43.45%.
- Its 3 year revenue growth rate is now at 110.5%.

The table below shows PCTY's growth in key financial areas (numbers in millions of US dollars).
Date | Revenue | Operating Cash Flow | Net Income to Common Stock |
---|---|---|---|
2021-12-31 | 731.238 | 132.036 | 89.502 |
2021-09-30 | 681.53 | 122.285 | 89.291 |
2021-06-30 | 635.627 | 124.85 | 70.819 |
2021-03-31 | 598.765 | 111.62 | 63.886 |
2020-12-31 | 584.358 | 96.249 | 67.184 |
2020-09-30 | 570.403 | 102.823 | 63.009 |
PCTY's Quality Factors
The “Quality” component of the POWR Ratings focuses on 31 different factors of a companies fundamentals and operational strength. Here are some key insights as we drill into the specifics of these quality attributes.- PCTY has a Quality Grade of C, ranking ahead of 60.18% of graded US stocks.
- PCTY's asset turnover comes in at 0.256 -- ranking 461st of 563 Business Services stocks.
- PAYC, STCN, and V are the stocks whose asset turnover ratios are most correlated with PCTY.
The table below shows PCTY's key quality metrics over time.
Period | Asset Turnover | Gross Margin | ROIC |
---|---|---|---|
2021-06-30 | 0.256 | 0.655 | 0.149 |
2021-03-31 | 0.252 | 0.656 | 0.133 |
2020-12-31 | 0.257 | 0.663 | 0.151 |
2020-09-30 | 0.266 | 0.669 | 0.160 |
2020-06-30 | 0.275 | 0.676 | 0.182 |
2020-03-31 | 0.276 | 0.680 | 0.234 |
PCTY Price Target
For more insight on analysts targets of PCTY, see our PCTY price target page. And for a list of of all stocks sorted by upside potential based on analyst target price, see our Top Price Target page.
Average Price Target | $255.69 | Average Broker Recommendation | 1.57 (Moderate Buy) |
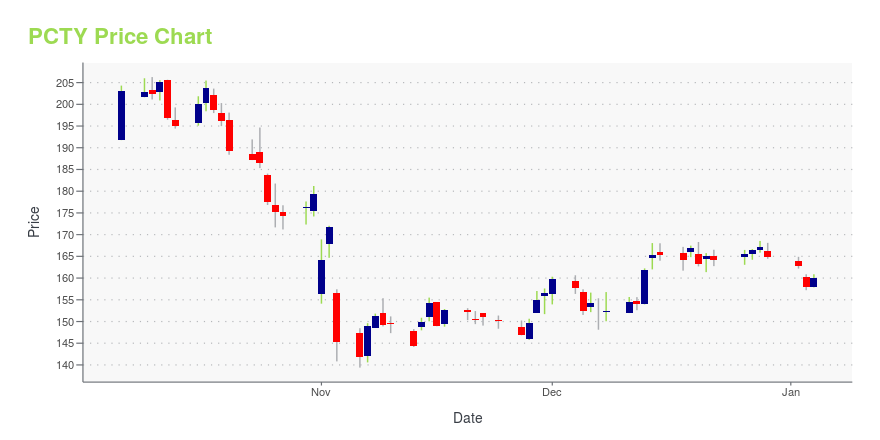
PCTY Stock Price Chart Interactive Chart >
PCTY Price/Volume Stats
Current price | $161.71 | 52-week high | $314.49 |
Prev. close | $158.59 | 52-week low | $152.97 |
Day low | $156.10 | Volume | 634,300 |
Day high | $164.22 | Avg. volume | 280,320 |
50-day MA | $193.26 | Dividend yield | N/A |
200-day MA | $232.68 | Market Cap | 8.91B |
Paylocity Holding Corporation (PCTY) Company Bio
Paylocity Holding Corporation provides cloud-based payroll and human capital management (HCM) software solutions for medium-sized organizations in the United States. The company was founded in 1997 and is based in Arlington Heights, Illinois.
Latest PCTY News From Around the Web
Below are the latest news stories about Paylocity Holding Corp that investors may wish to consider to help them evaluate PCTY as an investment opportunity.
Investing in Paylocity Holding (NASDAQ:PCTY) five years ago would have delivered you a 465% gainPaylocity Holding Corporation ( NASDAQ:PCTY ) shareholders might be concerned after seeing the share price drop 21% in... |
Paylocity (PCTY) Receives a Buy from NeedhamIn a report released today, Scott Berg from Needham maintained a Buy rating on Paylocity (PCTY – Research Report), with a price target of $325.00. The company's shares closed last Thursday at $197.06. According to TipRanks.com, Berg is a 5-star analyst with an average return of 17.2% and a 52.4% success rate. Berg covers the Technology sector, focusing on stocks such as BigCommerce Holdings, Ceridian HCM Holding, and Tyler Technologies. The word on The Street in general, suggests a Strong Buy analyst consensus rating for Paylocity with a $280.36 average price target, a 43.7% upside from current levels. |
Paylocity surges as Piper Sandler upgrades following Q2 results (NASDAQ:PCTY)Paylocity Holding (PCTY) shares surged in premarket trading on Friday after the payroll and HR software company posted second-quarter results that led to Piper Sandler upgrading the |
Paylocity (PCTY) Q2 Earnings and Revenues Beat EstimatesPaylocity's (PCTY) Q2 results reflect benefits from better sales executions, and the company's sustained investments in technological upgrades and product innovation. |
Paylocity Holding''s (PCTY) CEO Steve Beauchamp on Q2 2022 Results - Earnings Call TranscriptNo summary available. |
PCTY Price Returns
1-mo | -19.12% |
3-mo | -15.96% |
6-mo | -40.55% |
1-year | -3.59% |
3-year | 60.20% |
5-year | 268.11% |
YTD | -31.53% |
2021 | 14.69% |
2020 | 70.43% |
2019 | 100.66% |
2018 | 27.67% |
2017 | 57.15% |
Continue Researching PCTY
Want to see what other sources are saying about Paylocity Holding Corp's financials and stock price? Try the links below:Paylocity Holding Corp (PCTY) Stock Price | Nasdaq
Paylocity Holding Corp (PCTY) Stock Quote, History and News - Yahoo Finance
Paylocity Holding Corp (PCTY) Stock Price and Basic Information | MarketWatch
Loading social stream, please wait...