
Piedmont Office Realty Trust, Inc. (PDM): Price and Financial Metrics
PDM Price/Volume Stats
| Current price | $8.74 | 52-week high | $8.78 |
| Prev. close | $8.37 | 52-week low | $4.91 |
| Day low | $8.51 | Volume | 785,542 |
| Day high | $8.78 | Avg. volume | 909,766 |
| 50-day MA | $7.44 | Dividend yield | 6.01% |
| 200-day MA | $6.73 | Market Cap | 1.08B |
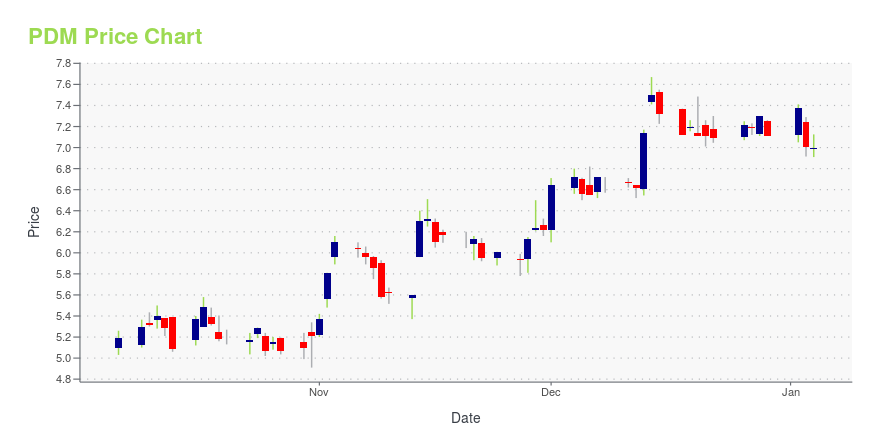
PDM Stock Price Chart Interactive Chart >
Piedmont Office Realty Trust, Inc. (PDM) Company Bio
Piedmont Office Realty Trust engages in the acquisition and ownership of commercial real estate properties in the United States. Its property portfolio primarily consists of office and industrial buildings, warehouses, and manufacturing facilities. The company was founded in 1997 and is based in Norcross, Georgia.
Latest PDM News From Around the Web
Below are the latest news stories about PIEDMONT OFFICE REALTY TRUST INC that investors may wish to consider to help them evaluate PDM as an investment opportunity.
Newmark, on Behalf of Piedmont Office Realty Trust, Inc., Secures 447,000 SF Renewal of U.S. Bancorp's HeadquartersNewmark announces that it has secured a 447,000-square-foot lease renewal with U.S. Bancorp (NYSE:USB) ("US Bancorp") on behalf of its client, Piedmont Office Realty Trust, Inc. (NYSE: PDM) ("Piedmont"), in its capacity as owner, at the 32-story, award-winning 800 Nicollet Mall headquarters in Minneapolis, Minnesota. With the renewal, U.S. Bancorp reaffirms its commitment to Piedmont and Minneapolis–its headquarters city for more than two decades. Newmark Senior Managing Director Brent Erickson |
Piedmont Office Realty Trust, Inc. (NYSE:PDM) Q3 2023 Earnings Call TranscriptPiedmont Office Realty Trust, Inc. (NYSE:PDM) Q3 2023 Earnings Call Transcript October 31, 2023 Operator: Greetings, and welcome to the Piedmont Office Realty Trust Incorporated Third Quarter 2023 Earnings Call. At this time, all participants are on a listen-only mode, and the floor will be open for questions and comments following the presentation. [Operator Instructions] […] |
Q3 2023 Piedmont Office Realty Trust Inc Earnings CallQ3 2023 Piedmont Office Realty Trust Inc Earnings Call |
Piedmont Office Realty Trust Inc (PDM) Reports Q3 2023 EarningsNet Loss of $17 Million Despite Revenue Increase |
Piedmont Office Realty Trust Reports Third Quarter 2023 ResultsAtlanta, Oct. 30, 2023 (GLOBE NEWSWIRE) -- Piedmont Office Realty Trust, Inc. ("Piedmont" or the "Company") (NYSE:PDM), an owner of Class A office properties located primarily in major U.S. Sunbelt markets, today announced its results for the quarter ended September 30, 2023. Highlights for the Three Months Ended September 30, 2023: Financial Results: Three Months Ended(in 000s other than per share amounts )September 30, 2023September 30, 2022Net income/(loss) applicable to Piedmont$(17,002)$3,3 |
PDM Price Returns
| 1-mo | 24.86% |
| 3-mo | 32.57% |
| 6-mo | 23.21% |
| 1-year | 30.70% |
| 3-year | -42.51% |
| 5-year | -41.37% |
| YTD | 27.54% |
| 2023 | -14.77% |
| 2022 | -46.76% |
| 2021 | 18.58% |
| 2020 | -23.46% |
| 2019 | 35.96% |
PDM Dividends
| Ex-Dividend Date | Type | Payout Amount | Change | ||||||
|---|---|---|---|---|---|---|---|---|---|
| Loading, please wait... | |||||||||
Continue Researching PDM
Want to see what other sources are saying about Piedmont Office Realty Trust Inc's financials and stock price? Try the links below:Piedmont Office Realty Trust Inc (PDM) Stock Price | Nasdaq
Piedmont Office Realty Trust Inc (PDM) Stock Quote, History and News - Yahoo Finance
Piedmont Office Realty Trust Inc (PDM) Stock Price and Basic Information | MarketWatch
Loading social stream, please wait...