
Healthpeak Properties Inc. (PEAK): Price and Financial Metrics
PEAK Price/Volume Stats
| Current price | $17.10 | 52-week high | $24.46 |
| Prev. close | $16.75 | 52-week low | $15.24 |
| Day low | $16.49 | Volume | 9,979,100 |
| Day high | $17.14 | Avg. volume | 7,814,412 |
| 50-day MA | $18.67 | Dividend yield | 7.02% |
| 200-day MA | $19.12 | Market Cap | 9.36B |
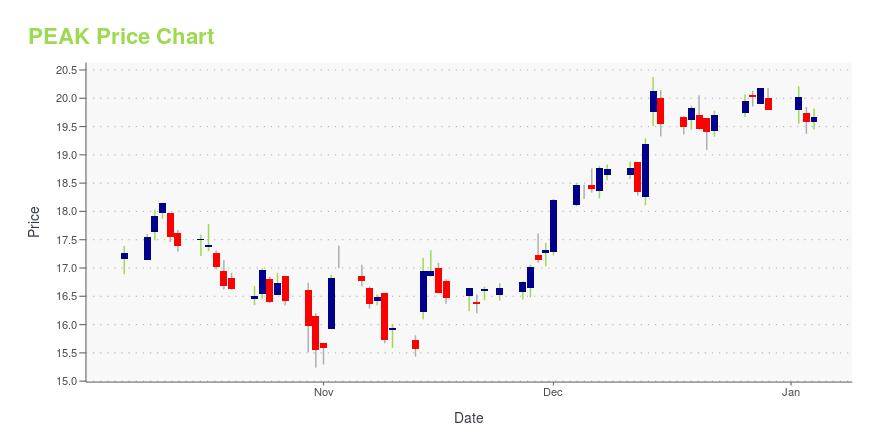
PEAK Stock Price Chart Interactive Chart >
Healthpeak Properties Inc. (PEAK) Company Bio
Healthpeak Properties, Inc. is a real estate investment trust that invests in real estate related to the healthcare industry including senior housing, life science, and medical offices. It is organized in Maryland and headquartered in Denver, Colorado with offices in Nashville and San Francisco. As of December 31, 2019, the company owned interests in 617 properties. (Source:Wikipedia)
Latest PEAK News From Around the Web
Below are the latest news stories about HEALTHPEAK PROPERTIES INC that investors may wish to consider to help them evaluate PEAK as an investment opportunity.
Top 3 Real Estate Stock Picks for the New YearReal estate stocks are set to top the charts in 2024 since they typically outperform standard stocks after a Fed tightening cycle ends. |
Healthpeak Properties Receives Entitlements for an Additional 1.3 Million Square Feet of Development at the Vantage Campus in South San FranciscoDENVER, December 19, 2023--Healthpeak Properties, Inc. (NYSE: PEAK) ("Healthpeak"), a leading owner, operator, and developer of real estate for healthcare discovery and delivery, today announced it has received approval of entitlements for Phases II and III of its purpose-built lab development campus, Vantage, in South San Francisco. |
Judith A. Reinsdorf and Katherine M. Sandstrom Named to Toll Brothers Board of DirectorsFORT WASHINGTON, Pa., Dec. 13, 2023 (GLOBE NEWSWIRE) -- Toll Brothers, Inc. (NYSE: TOL) (TollBrothers.com), the nation’s leading builder of luxury homes, today announced that Judith A. Reinsdorf and Katherine M. Sandstrom have joined the Company’s Board of Directors. In addition, Carl B. Marbach, age 82, has informed the Company that he will not stand for re-election and will step down from the Board at its next annual meeting of stockholders in March 2024. Ms. Reinsdorf, age 59, most recently s |
Cohen & Steers Announces Changes to Realty IndexesCohen & Steers, Inc. (NYSE: CNS) announced today pending changes to its Realty Majors Portfolio Index (RMP) and Global Realty Majors Portfolio Index (GRM), effective as of the close of business on November 17, 2023. |
It's Merger Monday for Real-Estate Investment TrustsMerger mania swept the beleaguered real-estate sector on Monday with the announcement of two multi-billion dollar deals. San Diego's **Realty Income** ([O](https://www.wsj.com/market-data/quotes/O)) agreed to buy Dallas-based **Spirit Realty Capital** ([SRC](https://www. |
PEAK Price Returns
| 1-mo | N/A |
| 3-mo | N/A |
| 6-mo | -10.41% |
| 1-year | -17.71% |
| 3-year | -47.15% |
| 5-year | -33.26% |
| YTD | -12.13% |
| 2023 | -16.40% |
| 2022 | -27.53% |
| 2021 | 23.74% |
| 2020 | -7.69% |
| 2019 | 29.16% |
PEAK Dividends
| Ex-Dividend Date | Type | Payout Amount | Change | ||||||
|---|---|---|---|---|---|---|---|---|---|
| Loading, please wait... | |||||||||
Loading social stream, please wait...