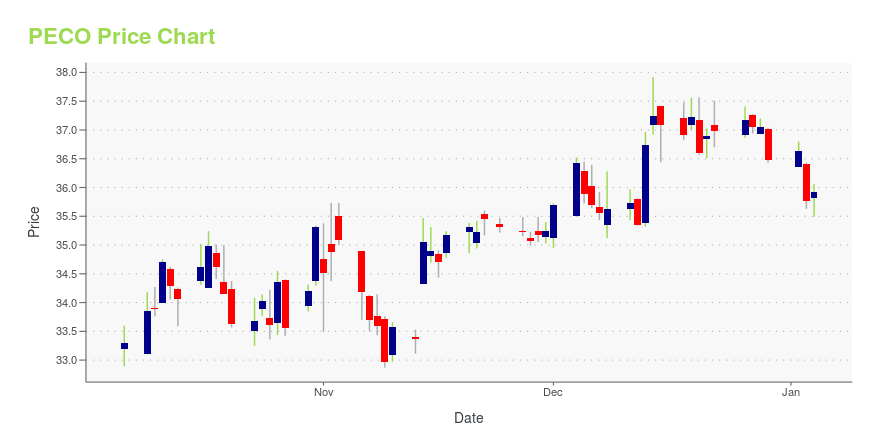
Phillips Edison & Company, Inc. (PECO): Price and Financial Metrics
PECO Price/Volume Stats
| Current price | $35.45 | 52-week high | $40.12 |
| Prev. close | $35.72 | 52-week low | $31.75 |
| Day low | $35.19 | Volume | 685,200 |
| Day high | $35.59 | Avg. volume | 764,118 |
| 50-day MA | $35.35 | Dividend yield | 3.44% |
| 200-day MA | $36.76 | Market Cap | 4.45B |
PECO Stock Price Chart Interactive Chart >
Phillips Edison & Company, Inc. (PECO) Company Bio
Phillips Edison & Company, Inc. (ÂPECOÂ), an internally-managed REIT, is one of the nation's largest owners and operators of grocery-anchored shopping centers. PECO's diversified portfolio of well-occupied neighborhood shopping centers features a mix of national and regional retailers selling necessity-based goods and services in fundamentally strong markets throughout the United States. Through its vertically-integrated operating platform, the Company manages a portfolio of 309 properties, including 283 wholly-owned properties comprising approximately 31.7 million square feet across 31 states (as of September 30, 2020). PECO has generated strong operating results over its 29+ year history and has partnered with leading institutional commercial real estate investors, including TPG Real Estate and The Northwestern Mutual Life Insurance Company. The Company remains exclusively focused on creating great grocery-anchored shopping experiences and improving the communities it serves one center at a time.
PECO Price Returns
| 1-mo | -0.94% |
| 3-mo | 2.72% |
| 6-mo | -8.45% |
| 1-year | 13.76% |
| 3-year | 18.15% |
| 5-year | N/A |
| YTD | -4.00% |
| 2024 | 6.18% |
| 2023 | 18.51% |
| 2022 | -0.33% |
| 2021 | N/A |
| 2020 | N/A |
PECO Dividends
| Ex-Dividend Date | Type | Payout Amount | Change | ||||||
|---|---|---|---|---|---|---|---|---|---|
| Loading, please wait... | |||||||||


Loading social stream, please wait...