
PEDEVCO Corp. (PED): Price and Financial Metrics
PED Price/Volume Stats
| Current price | $1.01 | 52-week high | $1.13 |
| Prev. close | $1.00 | 52-week low | $0.61 |
| Day low | $0.99 | Volume | 20,404 |
| Day high | $1.02 | Avg. volume | 106,159 |
| 50-day MA | $0.94 | Dividend yield | N/A |
| 200-day MA | $0.85 | Market Cap | 90.25M |
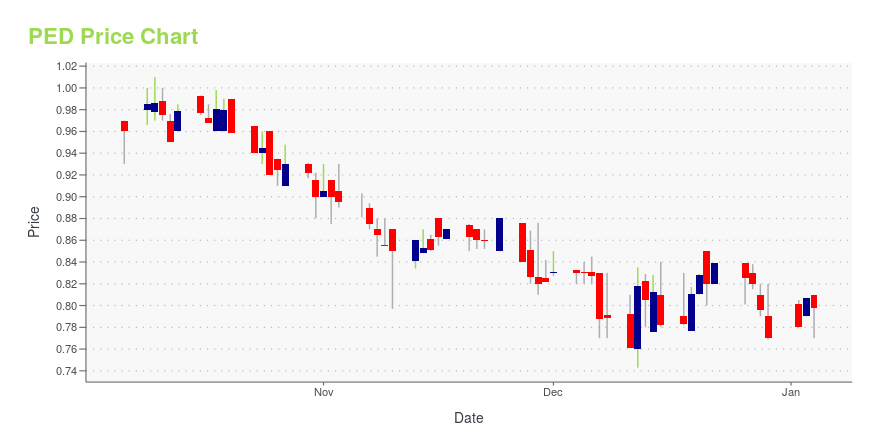
PED Stock Price Chart Interactive Chart >
PEDEVCO Corp. (PED) Company Bio
PEDEVCO Corp. is an independent energy company. It engages in the acquisition, exploration, development, and production of oil and natural gas resources in the United States. The firm primarily focuses on oil and natural gas shale plays, and conventional oil and natural gas plays. The company was founded by Frank C. Ingriselli on February 9, 2011 and is headquartered in Houston, TX.
Latest PED News From Around the Web
Below are the latest news stories about PEDEVCO CORP that investors may wish to consider to help them evaluate PED as an investment opportunity.
PEDEVCO Announces Q3 2023 Financial Results and Operations UpdateHOUSTON, TX / ACCESSWIRE / November 9, 2023 / PEDEVCO Corp. (NYSE American:PED) ("PEDEVCO" or the "Company"), an energy company engaged in the acquisition and development of strategic, high growth energy projects in the U.S., today announced its financial ... |
Q4 2023 Evolution Petroleum Corp Earnings CallQ4 2023 Evolution Petroleum Corp Earnings Call |
Evolution Petroleum and PEDEVCO Enter into Strategic Partnership to Jointly Develop PEDEVCO’s Chaveroo Field in the Permian BasinEvolution Petroleum Corporation (NYSE American:EPM) ("Evolution") and PEDEVCO Corp. (NYSE American:PED) ("PEDEVCO") today announced entry into a definitive Participation Agreement to jointly develop PEDEVCO's Chaveroo oilfield in the Northwest Shelf ("NWS") of southeastern New Mexico, a conventional oil-bearing San Andres field in the Permian Basin located in Chaves and Roosevelt Counties. |
PEDEVCO Announces Q2 2023 Financial Results and Operations UpdatePEDEVCO Corp. (NYSE American:PED) ("PEDEVCO" or the "Company"), an energy company engaged in the acquisition and development of strategic, high growth energy projects in the U.S., today announced its financial results for the six months ended June 30, 2023 and provided an operations update. |
PEDEVCO Announces Expansion into Wyoming D-J Basin Codell PlayPEDEVCO Corp. (NYSE American:PED) (the "Company") today announced that it has significantly expanded its oil and gas leasehold into Southeastern Wyoming through the acquisition of over 4,000 net leasehold acres in the highly prospective Codell play in Southeastern Wyoming's D-J Basin, increasing the Company's D-J Basin footprint to over 17,000 net acres across Northeastern Colorado and Southeastern Wyoming. |
PED Price Returns
| 1-mo | 11.05% |
| 3-mo | 4.12% |
| 6-mo | 51.31% |
| 1-year | 11.48% |
| 3-year | -10.62% |
| 5-year | -25.19% |
| YTD | 31.15% |
| 2023 | -29.99% |
| 2022 | 3.77% |
| 2021 | -29.80% |
| 2020 | -9.04% |
| 2019 | 118.42% |
Continue Researching PED
Want to see what other sources are saying about Pedevco Corp's financials and stock price? Try the links below:Pedevco Corp (PED) Stock Price | Nasdaq
Pedevco Corp (PED) Stock Quote, History and News - Yahoo Finance
Pedevco Corp (PED) Stock Price and Basic Information | MarketWatch
Loading social stream, please wait...