Penumbra, Inc. (PEN): Price and Financial Metrics
PEN Price/Volume Stats
Current price | $245.61 | 52-week high | $348.67 |
Prev. close | $247.16 | 52-week low | $144.76 |
Day low | $244.01 | Volume | 158,800 |
Day high | $248.09 | Avg. volume | 357,864 |
50-day MA | $270.29 | Dividend yield | N/A |
200-day MA | $275.86 | Market Cap | 9.44B |
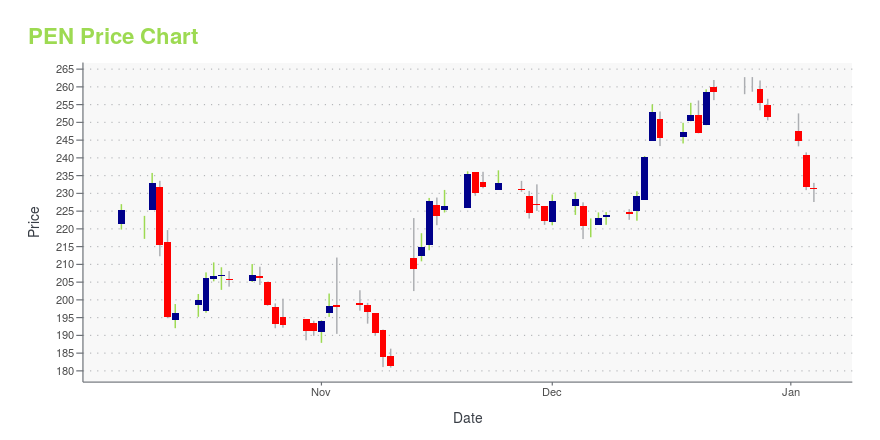
PEN Stock Price Chart Interactive Chart >
PEN POWR Grades
- PEN scores best on the Growth dimension, with a Growth rank ahead of 99.65% of US stocks.
- The strongest trend for PEN is in Growth, which has been heading up over the past 177 days.
- PEN's current lowest rank is in the Momentum metric (where it is better than 6.97% of US stocks).
PEN Stock Summary
- PEN's current price/earnings ratio is 326.64, which is higher than 98.26% of US stocks with positive earnings.
- Price to trailing twelve month operating cash flow for PEN is currently 509.98, higher than 99.58% of US stocks with positive operating cash flow.
- Over the past twelve months, PEN has reported earnings growth of -199.29%, putting it ahead of just 7.2% of US stocks in our set.
- Stocks that are quantitatively similar to PEN, based on their financial statements, market capitalization, and price volatility, are MNTX, FLYW, LTRX, CYRX, and ISSC.
- PEN's SEC filings can be seen here. And to visit PENUMBRA INC's official web site, go to www.penumbrainc.com.
PEN Valuation Summary
- In comparison to the median Healthcare stock, PEN's price/earnings ratio is 1123.22% higher, now standing at 326.6.
- PEN's price/sales ratio has moved up 1.8 over the prior 98 months.
Below are key valuation metrics over time for PEN.
Stock | Date | P/S | P/B | P/E | EV/EBIT |
---|---|---|---|---|---|
PEN | 2023-09-22 | 10.1 | 8.9 | 326.6 | 251.9 |
PEN | 2023-09-21 | 10.3 | 9.0 | 330.4 | 254.8 |
PEN | 2023-09-20 | 10.8 | 9.5 | 346.3 | 266.9 |
PEN | 2023-09-19 | 10.8 | 9.5 | 346.7 | 267.2 |
PEN | 2023-09-18 | 10.7 | 9.5 | 346.1 | 266.7 |
PEN | 2023-09-15 | 11.0 | 9.6 | 353.1 | 272.1 |
PEN Growth Metrics
- The 4 year revenue growth rate now stands at 99.67%.
- Its 4 year price growth rate is now at 120.95%.
- Its year over year cash and equivalents growth rate is now at 22.52%.

The table below shows PEN's growth in key financial areas (numbers in millions of US dollars).
Date | Revenue | Operating Cash Flow | Net Income to Common Stock |
---|---|---|---|
2022-12-31 | 847.133 | -55.661 | -2.002 |
2022-09-30 | 829.928 | -66.268 | -30.512 |
2022-06-30 | 806.367 | -16.909 | -19.391 |
2022-03-31 | 782.281 | 19.356 | -6.473 |
2021-12-31 | 747.59 | 9.502 | 5.284 |
2021-09-30 | 710.477 | 16.689 | 33.565 |
PEN's Quality Factors
The “Quality” component of the POWR Ratings focuses on 31 different factors of a companies fundamentals and operational strength. Here are some key insights as we drill into the specifics of these quality attributes.- PEN has a Quality Grade of C, ranking ahead of 49.95% of graded US stocks.
- PEN's asset turnover comes in at 0.794 -- ranking 38th of 186 Medical Equipment stocks.
- IVC, NTUS, and MLSS are the stocks whose asset turnover ratios are most correlated with PEN.
The table below shows PEN's key quality metrics over time.
Period | Asset Turnover | Gross Margin | ROIC |
---|---|---|---|
2021-06-30 | 0.794 | 0.618 | 0.009 |
2021-03-31 | 0.728 | 0.610 | -0.030 |
2020-12-31 | 0.728 | 0.603 | -0.054 |
2020-09-30 | 0.738 | 0.635 | -0.038 |
2020-06-30 | 0.774 | 0.658 | 0.017 |
2020-03-31 | 0.880 | 0.676 | 0.079 |
PEN Price Target
For more insight on analysts targets of PEN, see our PEN price target page. And for a list of of all stocks sorted by upside potential based on analyst target price, see our Top Price Target page.
Average Price Target | $319.80 | Average Broker Recommendation | 1.31 (Strong Buy) |
Penumbra, Inc. (PEN) Company Bio
Penumbra Inc. is a specialty interventional therapies company that develops and markets innovative medical devices to treat challenging medical conditions with significant unmet clinical needs. The company was founded in 2004 and is based in Alameda, CA.
Latest PEN News From Around the Web
Below are the latest news stories about PENUMBRA INC that investors may wish to consider to help them evaluate PEN as an investment opportunity.
Penumbra and Mesa Labs have been highlighted as Zacks Bull and Bear of the DayPenumbra and Mesa Labs are part of the Zacks Bull and Bear of the Day article. |
Bull of the Day: Penumbra (PEN)Innovator of neurovascular stroke technologies with 980% EPS growth is a buying opportunity |
The Zacks Rank Explained: How to Find Strong Buy Medical StocksThe Zacks Rank offers investors a way to easily find top-rated stocks and build a winning investment portfolio. Here's why you should take advantage. |
Encompass Health (EHC) Up 41% in a Year: More Room for Growth?Encompass Health (EHC) is well-poised for growth on the back of growing revenues, an aging U.S. population, joint ventures and solid cash reserves. |
Is First Trust Health Care AlphaDEX ETF (FXH) a Strong ETF Right Now?Smart Beta ETF report for FXH |
PEN Price Returns
1-mo | -2.31% |
3-mo | -25.44% |
6-mo | -11.36% |
1-year | 34.57% |
3-year | 26.49% |
5-year | 64.67% |
YTD | 10.41% |
2022 | -22.57% |
2021 | 64.18% |
2020 | 6.53% |
2019 | 34.43% |
2018 | 29.86% |
Continue Researching PEN
Here are a few links from around the web to help you further your research on Penumbra Inc's stock as an investment opportunity:Penumbra Inc (PEN) Stock Price | Nasdaq
Penumbra Inc (PEN) Stock Quote, History and News - Yahoo Finance
Penumbra Inc (PEN) Stock Price and Basic Information | MarketWatch
Loading social stream, please wait...