
Penn Entertainment Inc. (PENN): Price and Financial Metrics
PENN Price/Volume Stats
| Current price | $19.71 | 52-week high | $29.38 |
| Prev. close | $18.19 | 52-week low | $13.50 |
| Day low | $18.87 | Volume | 4,473,596 |
| Day high | $20.00 | Avg. volume | 6,088,129 |
| 50-day MA | $18.05 | Dividend yield | N/A |
| 200-day MA | $20.15 | Market Cap | 3.00B |
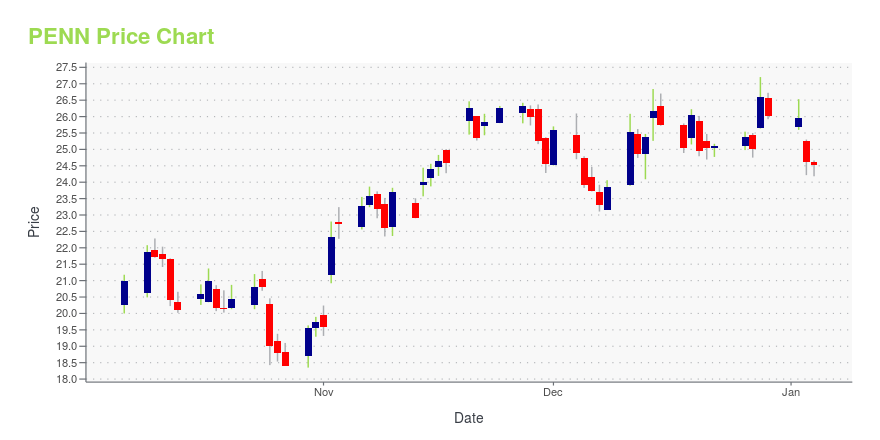
PENN Stock Price Chart Interactive Chart >
Penn Entertainment Inc. (PENN) Company Bio
Penn Entertainment, Inc., formerly Penn National Gaming, is an American operator of casinos and racetracks based in Wyomissing, Pennsylvania. It operates 43 facilities in the United States and Canada, many of them under the Hollywood Casino brand. The company also owns a 36% stake in Barstool Sports. In 2013, Penn completed the corporate spin-off of Gaming and Leisure Properties, a real estate investment trust. (Source:Wikipedia)
Latest PENN News From Around the Web
Below are the latest news stories about PENN ENTERTAINMENT INC that investors may wish to consider to help them evaluate PENN as an investment opportunity.
PENN Entertainment Inc President and CEO Jay Snowden Sells 172,930 SharesOn December 26, 2023, Jay Snowden, President and CEO of PENN Entertainment Inc (NASDAQ:PENN), executed a sale of 172,930 shares of the company. |
Altice, AMD, Penn Entertainment: Trending TickersAmerican cable provider Altice USA (ATUS) will be selling Cheddar News to media company Archetype, a subsidiary of private equity firm Regent which owns publications like the Military Times. Chipmaker Advanced Micro Devices (AMD) shares are on the rise Thursday afternoon, already up 129% in 2023 year-to-date. AMD seeks to tighten competition with rival semiconductor manufacturer Nvidia (NVDA) in the AI race heading into 2024. HG Vora Capital is currently requesting a seat on the board of casino operator Penn Entertainment (PENN). For more expert insight and the latest market action, click here to watch this full episode of Yahoo Finance Live. |
Penn Entertainment Stock Is Rising. Top Shareholder Wants Board Seats.Hedge fund HG Vora Capital Management says shares of the casino operator and online-betting company are ‘significantly undervalued.’ |
A Top Penn Entertainment Shareholder Seeks Board SeatsA top shareholder in Penn Entertainment is seeking seats on the casino operator’s board. HG Vora invested in the casino operators Penn National Gaming—as it was formerly known—and Pinnacle Entertainment before they agreed to merge in 2017. |
7 F-Rated Consumer Discretionary Stocks to Ditch in DecemberConsumers are usually pretty free-spending over the holidays, but they consistently turn away from these consumer discretionary stocks. |
PENN Price Returns
| 1-mo | 7.70% |
| 3-mo | 16.90% |
| 6-mo | -16.23% |
| 1-year | -22.19% |
| 3-year | -72.54% |
| 5-year | 1.13% |
| YTD | -24.25% |
| 2023 | -12.39% |
| 2022 | -42.72% |
| 2021 | -39.97% |
| 2020 | 237.91% |
| 2019 | 35.74% |
Continue Researching PENN
Want to do more research on Penn National Gaming Inc's stock and its price? Try the links below:Penn National Gaming Inc (PENN) Stock Price | Nasdaq
Penn National Gaming Inc (PENN) Stock Quote, History and News - Yahoo Finance
Penn National Gaming Inc (PENN) Stock Price and Basic Information | MarketWatch
Loading social stream, please wait...