Pfizer Inc. (PFE): Price and Financial Metrics
PFE Price/Volume Stats
Current price | $38.02 | 52-week high | $54.93 |
Prev. close | $37.01 | 52-week low | $36.17 |
Day low | $36.87 | Volume | 46,166,297 |
Day high | $38.22 | Avg. volume | 24,238,059 |
50-day MA | $39.37 | Dividend yield | 4.36% |
200-day MA | $44.41 | Market Cap | 214.63B |
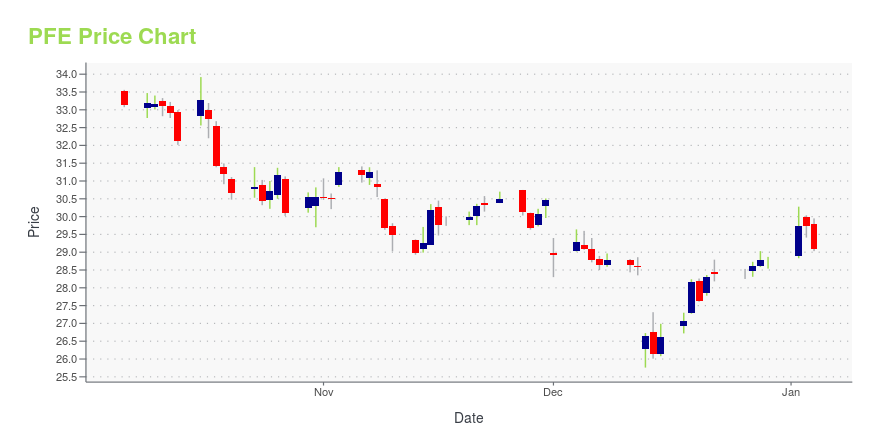
PFE Stock Price Chart Interactive Chart >
PFE POWR Grades
- Value is the dimension where PFE ranks best; there it ranks ahead of 98.3% of US stocks.
- The strongest trend for PFE is in Growth, which has been heading down over the past 179 days.
- PFE's current lowest rank is in the Growth metric (where it is better than 2.47% of US stocks).
PFE Stock Summary
- PFE has a higher market value than 99.35% of US stocks; more precisely, its current market capitalization is $218,078,210,183.
- PFE's went public 37.42 years ago, making it older than 93.61% of listed US stocks we're tracking.
- PFE's current price/earnings ratio is 7.51, which is higher than just 23.16% of US stocks with positive earnings.
- Stocks with similar financial metrics, market capitalization, and price volatility to PFIZER INC are NVS, CSCO, ABBV, NFLX, and SAP.
- Visit PFE's SEC page to see the company's official filings. To visit the company's web site, go to www.pfizer.com.
PFE Valuation Summary
- In comparison to the median Healthcare stock, PFE's price/sales ratio is 9.09% higher, now standing at 2.4.
- PFE's price/earnings ratio has moved down 13.2 over the prior 243 months.
Below are key valuation metrics over time for PFE.
Stock | Date | P/S | P/B | P/E | EV/EBIT |
---|---|---|---|---|---|
PFE | 2023-05-23 | 2.4 | 2.2 | 7.7 | 8.1 |
PFE | 2023-05-22 | 2.4 | 2.2 | 7.5 | 7.9 |
PFE | 2023-05-19 | 2.2 | 2.1 | 7.1 | 7.6 |
PFE | 2023-05-18 | 2.2 | 2.0 | 7.1 | 7.5 |
PFE | 2023-05-17 | 2.2 | 2.1 | 7.1 | 7.6 |
PFE | 2023-05-16 | 2.2 | 2.1 | 7.2 | 7.6 |
PFE Growth Metrics
- Its 4 year net cashflow from operations growth rate is now at -11.47%.
- The 3 year revenue growth rate now stands at 71.5%.
- Its 5 year cash and equivalents growth rate is now at -46.98%.

The table below shows PFE's growth in key financial areas (numbers in millions of US dollars).
Date | Revenue | Operating Cash Flow | Net Income to Common Stock |
---|---|---|---|
2022-09-30 | 99,676 | 26,599 | 29,771 |
2022-06-30 | 101,132 | 31,454 | 29,309 |
2022-03-31 | 92,367 | 34,583 | 24,966 |
2021-12-31 | 81,288 | 32,580 | 21,979 |
2021-09-30 | 63,600 | 32,291 | 19,180 |
2021-06-30 | 51,637 | 23,552 | 13,228 |
PFE's Quality Factors
The “Quality” component of the POWR Ratings focuses on 31 different factors of a companies fundamentals and operational strength. Here are some key insights as we drill into the specifics of these quality attributes.- PFE has a Quality Grade of B, ranking ahead of 88% of graded US stocks.
- PFE's asset turnover comes in at 0.312 -- ranking 146th of 682 Pharmaceutical Products stocks.
- XBIT, NERV, and BLUE are the stocks whose asset turnover ratios are most correlated with PFE.
The table below shows PFE's key quality metrics over time.
Period | Asset Turnover | Gross Margin | ROIC |
---|---|---|---|
2021-07-04 | 0.312 | 0.704 | 0.149 |
2021-04-04 | 0.265 | 0.763 | 0.116 |
2020-12-31 | 0.247 | 0.793 | 0.099 |
2020-09-27 | 0.282 | 0.799 | 0.083 |
2020-06-28 | 0.288 | 0.799 | 0.181 |
2020-03-29 | 0.307 | 0.799 | 0.200 |
PFE Price Target
For more insight on analysts targets of PFE, see our PFE price target page. And for a list of of all stocks sorted by upside potential based on analyst target price, see our Top Price Target page.
Average Price Target | $46.03 | Average Broker Recommendation | 1.8 (Hold) |
Pfizer Inc. (PFE) Company Bio
Pfizer Inc. is a biopharmaceutical company that discovers, develops, manufactures, and markets healthcare products including medicines, and vaccines as well as many of the consumer healthcare products. Pfizer was founded under its original name, Charles Pfizer & Company, in 1849 in Brooklyn, New York by Charles Pfizer and Charles Erhart. The company operates research and development facilities in United States and the United Kingdom and employs over 78,000 individuals worldwide. Some of the company’s more recognizable brands include Advil, Celebrex, Chantix, Chapstick, Dimetapp, Lipitor, Robitussin, and Viagra. Albert Bourla serves as Pfizer’s Chairman of the Board and Chief Executive Officer and the company is headquartered in New York, New York.
Latest PFE News From Around the Web
Below are the latest news stories about PFIZER INC that investors may wish to consider to help them evaluate PFE as an investment opportunity.
Most Active Equity Options For Midday - Tuesday, May 23Here are the most active equity options for midday. |
3 High-Reward Stocks Riding the Healthcare BoomHealthcare stocks are a great option for long-term investors that want to ride out economic uncertainty and capitalize on the aging population. |
Why Pfizer Stock Crushed the Market on MondayThe holy grail of pharmaceutical companies and biotechs is the development of a medication with blockbuster potential, and Pfizer seems to have one on its hands. A peer-reviewed study of Pfizer's investigational drug danuglipron found that the medication lowered both blood sugar and body weight after 16 weeks of use when compared to a placebo. Compounding that, that level of weight loss is comparable to pharmaceutical rival Novo Nordisk's (NYSE: NVO) highly successful semaglutide, a commercialized drug known in this country as either Ozempic or Rybelsus for diabetes, and Wegovy for weight loss. |
Meta fine, Pfizer drug, retail earnings: Top headlinesYahoo Finance Live anchors Akiko Fujita and Seana Smith break down Monday's top headlines, including Meta being fined $1.3 billion, Pfizer's weight loss study, and retailers set to report earnings on Tuesday. |
Pfizer stock rises on positive results from weight loss drug studyYahoo Finance's Rachelle Akuffo details a rise in Pfizer stock after the company announced positive results from the study of a new weight loss drug. |
PFE Price Returns
1-mo | -1.61% |
3-mo | -6.61% |
6-mo | -23.82% |
1-year | -24.73% |
3-year | 26.37% |
5-year | 32.94% |
YTD | -24.31% |
2022 | -10.41% |
2021 | 66.70% |
2020 | 3.23% |
2019 | -6.91% |
2018 | 24.82% |
PFE Dividends
Ex-Dividend Date | Type | Payout Amount | Change | ||||||
---|---|---|---|---|---|---|---|---|---|
Loading, please wait... |
Continue Researching PFE
Want to see what other sources are saying about Pfizer Inc's financials and stock price? Try the links below:Pfizer Inc (PFE) Stock Price | Nasdaq
Pfizer Inc (PFE) Stock Quote, History and News - Yahoo Finance
Pfizer Inc (PFE) Stock Price and Basic Information | MarketWatch
Loading social stream, please wait...