Performance Food Group Company (PFGC): Price and Financial Metrics

Performance Food Group Company (PFGC): $59.09

0.63 (+1.08%)

POWR Rating

Component Grades

Momentum

D

Stability

C

Sentiment

Quality

C

Add PFGC to Watchlist
Sign Up

Industry: Food Makers

Industry

C

Ranked

#14 of 78

in industry

PFGC Price/Volume Stats

Current price $59.09 52-week high $64.34
Prev. close $58.46 52-week low $42.77
Day low $58.55 Volume 851,200
Day high $59.24 Avg. volume 1,029,094
50-day MA $60.48 Dividend yield N/A
200-day MA $59.31 Market Cap 9.23B

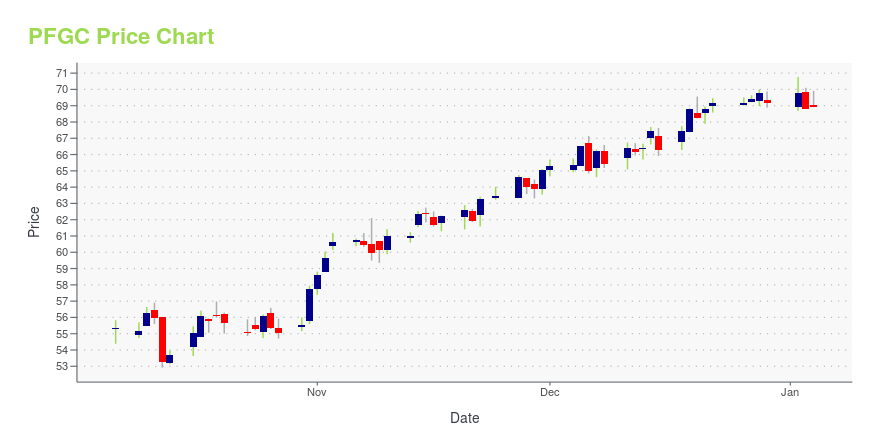
PFGC Stock Price Chart Interactive Chart >

PFGC POWR Grades

  • PFGC scores best on the Growth dimension, with a Growth rank ahead of 87.35% of US stocks.
  • The strongest trend for PFGC is in Growth, which has been heading down over the past 177 days.
  • PFGC ranks lowest in Momentum; there it ranks in the 14th percentile.

PFGC Stock Summary

  • PERFORMANCE FOOD GROUP CO's capital turnover -- a measure of revenue relative to shareholder's equity -- is better than 97.75% of US listed stocks.
  • PFGC's price/sales ratio is 0.16; that's higher than the P/S ratio of merely 4.93% of US stocks.
  • In terms of volatility of its share price, PFGC is more volatile than merely 1.51% of stocks we're observing.
  • Stocks with similar financial metrics, market capitalization, and price volatility to PERFORMANCE FOOD GROUP CO are AN, COKE, JLL, EME, and BJ.
  • Visit PFGC's SEC page to see the company's official filings. To visit the company's web site, go to www.pfgc.com.

PFGC Valuation Summary

  • PFGC's price/sales ratio is 0.2; this is 88.89% lower than that of the median Consumer Defensive stock.
  • Over the past 97 months, PFGC's price/sales ratio has gone up 0.1.

Below are key valuation metrics over time for PFGC.

Stock Date P/S P/B P/E EV/EBIT
PFGC 2023-09-22 0.2 2.5 23.6 18.5
PFGC 2023-09-21 0.2 2.5 23.7 18.5
PFGC 2023-09-20 0.2 2.6 24.2 18.8
PFGC 2023-09-19 0.2 2.6 24.1 18.8
PFGC 2023-09-18 0.2 2.6 24.1 18.8
PFGC 2023-09-15 0.2 2.5 23.8 18.6

PFGC Growth Metrics

    Its 5 year price growth rate is now at -12.27%.
  • Its 4 year net cashflow from operations growth rate is now at -66.03%.
  • Its 3 year revenue growth rate is now at 147.35%.
Over the past 15 months, PFGC's revenue has gone up $22,548,800,000.

The table below shows PFGC's growth in key financial areas (numbers in millions of US dollars).

Date Revenue Operating Cash Flow Net Income to Common Stock
2022-12-31 56,287.2 547.2 266.2
2022-09-30 55,227.1 560.6 203.5
2022-06-30 50,894.1 276.5 112.5
2022-03-31 45,608.5 282.1 67.9
2021-12-31 39,732 242.8 36.9
2021-09-30 33,738.4 228.4 46.1

PFGC's Quality Factors

The “Quality” component of the POWR Ratings focuses on 31 different factors of a companies fundamentals and operational strength. Here are some key insights as we drill into the specifics of these quality attributes.
  • PFGC has a Quality Grade of D, ranking ahead of 21.37% of graded US stocks.
  • PFGC's asset turnover comes in at 3.983 -- ranking 7th of 105 Wholesale stocks.
  • USFD, DLA, and INT are the stocks whose asset turnover ratios are most correlated with PFGC.

The table below shows PFGC's key quality metrics over time.

Period Asset Turnover Gross Margin ROIC
2021-07-03 3.983 0.116 0.034
2021-03-27 3.535 0.115 -0.017
2020-12-26 3.461 0.115 -0.024
2020-09-26 3.517 0.115 -0.022
2020-06-27 3.601 0.114 -0.018
2020-03-28 4.067 0.116 0.042

Performance Food Group Company (PFGC) Company Bio


Performance Food Group is one of the largest food delivery companies in the U.S., delivering products to restaurants, cafeterias, schools, theaters and other food venues. The company was founded in 1875 and is based in Goochland County, Virginia.


PFGC Latest News Stream


Event/Time News Detail
Loading, please wait...

PFGC Latest Social Stream


Loading social stream, please wait...

View Full PFGC Social Stream

Latest PFGC News From Around the Web

Below are the latest news stories about PERFORMANCE FOOD GROUP CO that investors may wish to consider to help them evaluate PFGC as an investment opportunity.

Vistar Commends Outstanding Achievements of 2023 Supplier Award Recipients

RICHMOND, Va., September 15, 2023--Vistar, a division of Performance Food Group Company (PFG) (NYSE: PFGC) and a leading distributor of candy, snacks and beverages, announced the winners of its 2023 Supplier Awards during the company’s recent annual business meeting.

Yahoo | September 15, 2023

HYZON MOTORS SUCCESSFULLY COMPLETES FIRST CUSTOMER DEMO OF LIQUID HYDROGEN FUEL CELL ELECTRIC TRUCK

Hyzon Motors Inc. (Hyzon) (NASDAQ: HYZN), a high-power hydrogen fuel cell technology developer and global supplier of zero-emission heavy-duty fuel cell electric vehicles, Performance Food Group, Inc. (PFG) (NYSE: PFGC), one of the largest food and foodservice distribution companies in North America, and Chart Industries, Inc. (Chart) (NYSE: GTLS), a leading global manufacturer of highly engineered equipment servicing multiple applications in the clean energy and industrial gas market, today ann

Yahoo | August 30, 2023

The 3 Best Food Stocks to Buy in August 2023

To satiate your appetite for resilient and growing businesses, here is a list of 3 food stocks to purchase in August.

Tyrik Torres on InvestorPlace | August 18, 2023

Performance Food Group (PFGC) Q4 Earnings Beat Estimates

Performance Food Group's (PFGC) fiscal fourth-quarter results reflect strong independent organic case growth, double-digit gross profit growth and a strong cash flow.

Yahoo | August 18, 2023

Company News for Aug 17, 2023

Companies In The News Are: HRB, TGT, TJX, PFGC.

Yahoo | August 17, 2023

Read More 'PFGC' Stories Here

PFGC Price Returns

1-mo -5.18%
3-mo -1.91%
6-mo -2.07%
1-year 32.40%
3-year 69.85%
5-year 77.45%
YTD 1.20%
2022 27.24%
2021 -3.61%
2020 -7.52%
2019 59.53%
2018 -2.51%

Get Free Updates

Join thousands of investors who get the latest news, insights and top rated picks from StockNews.com!