
Profire Energy, Inc. (PFIE): Price and Financial Metrics
PFIE Price/Volume Stats
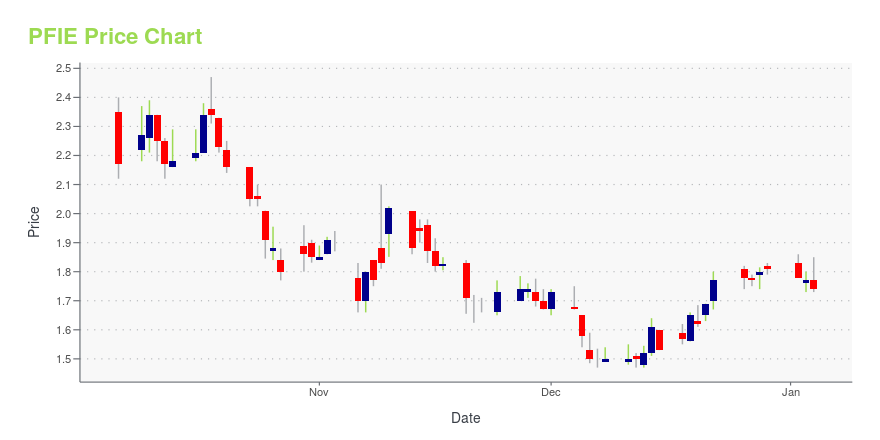
| Current price | $1.58 | 52-week high | $3.29 |
| Prev. close | $1.61 | 52-week low | $1.28 |
| Day low | $1.56 | Volume | 78,633 |
| Day high | $1.64 | Avg. volume | 201,734 |
| 50-day MA | $1.51 | Dividend yield | N/A |
| 200-day MA | $1.66 | Market Cap | 74.42M |
PFIE Stock Price Chart Interactive Chart >
Profire Energy, Inc. (PFIE) Company Bio
Profire Energy, Inc., an oilfield technology company, provides burner- and chemical-management products and services for the oil and gas industry primarily in the United States and Canada. It assists energy production companies in the production and transportation of oil and natural gas. The company offers burner-management systems to ignite, monitor, and manage the burner flames used in oilfield vessels, as well as complementary oilfield products, such as valves and fuel trains, airplates, solar packages, and flare stack igniters and nozzles. It also provides chemical-management systems to monitor and manage chemical-injection process to ensure that optimal levels of chemicals are injected. The company is based in Lindon, Utah.
Latest PFIE News From Around the Web
Below are the latest news stories about PROFIRE ENERGY INC that investors may wish to consider to help them evaluate PFIE as an investment opportunity.
7 Stocks to Buy if You’re Bullish on the Energy SectorOil prices are down right now, but there are some good energy stocks to buy if you're bullish about the energy sector. |
7 Under-$10 Names to Put in Your Christmas StockingStocks under $10 can serve as a memorable and potentially profitable addition to your Christmas stocking while diversifying your holdings. |
Investors in Profire Energy (NASDAQ:PFIE) have seen favorable returns of 90% over the past three yearsThe last three months have been tough on Profire Energy, Inc. ( NASDAQ:PFIE ) shareholders, who have seen the share... |
7 A-Rated Retirement Stocks for Your November Buy ListI know very few people who don’t look forward to retirement. |
Profire Energy, Inc. (NASDAQ:PFIE) Q3 2023 Earnings Call TranscriptProfire Energy, Inc. (NASDAQ:PFIE) Q3 2023 Earnings Call Transcript November 9, 2023 Operator: Good morning, everyone and thank you for participating in today’s Conference Call to discuss Profire Energy’s Quarterly Operating and Financial Performance for the period ended September 30, 2023. I will now turn the call over to Steven Hooser, Investor Relations to get […] |
PFIE Price Returns
| 1-mo | 9.72% |
| 3-mo | -11.73% |
| 6-mo | -1.25% |
| 1-year | 20.61% |
| 3-year | 50.48% |
| 5-year | 12.06% |
| YTD | -12.71% |
| 2023 | 70.75% |
| 2022 | 0.00% |
| 2021 | 24.34% |
| 2020 | -41.21% |
| 2019 | 0.00% |
Continue Researching PFIE
Want to see what other sources are saying about Profire Energy Inc's financials and stock price? Try the links below:Profire Energy Inc (PFIE) Stock Price | Nasdaq
Profire Energy Inc (PFIE) Stock Quote, History and News - Yahoo Finance
Profire Energy Inc (PFIE) Stock Price and Basic Information | MarketWatch
Loading social stream, please wait...