
Phreesia, Inc. (PHR): Price and Financial Metrics
PHR Price/Volume Stats
| Current price | $24.77 | 52-week high | $32.11 |
| Prev. close | $24.42 | 52-week low | $12.05 |
| Day low | $24.62 | Volume | 394,560 |
| Day high | $25.67 | Avg. volume | 490,484 |
| 50-day MA | $21.49 | Dividend yield | N/A |
| 200-day MA | $21.41 | Market Cap | 1.42B |
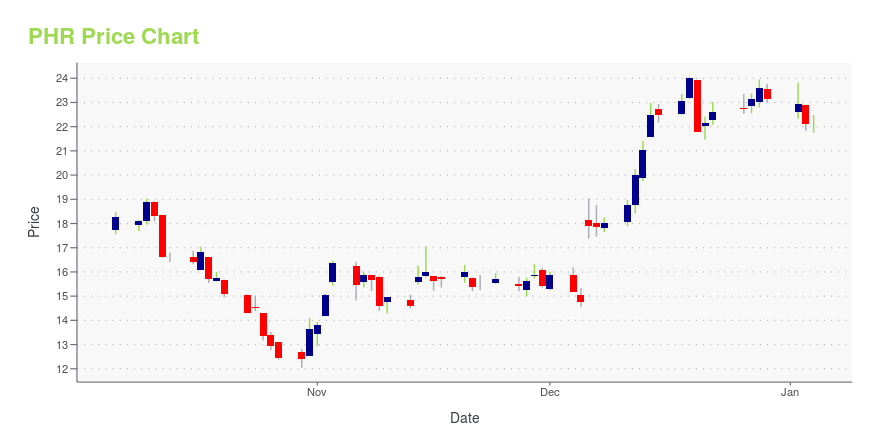
PHR Stock Price Chart Interactive Chart >
Phreesia, Inc. (PHR) Company Bio
Phreesia, Inc. provides patient check-in solutions for medical practices. It provides solutions that transform the healthcare experience by engaging patients in their care and enabling healthcare provider organizations to optimize operational efficiency, improve profitability and enhance clinical care. Through the SaaS-based Phreesia Platform the company offers healthcare provider organizations a robust suite of solutions to manage the patient intake process and a payments solution for secure processing of patient payments. Its platform also provides life sciences companies with an engagement channel for targeted and direct communication with patients. Phreesia was founded by Chaim Indig and Evan Roberts in January 2005 and is headquartered in New York, NY.
Latest PHR News From Around the Web
Below are the latest news stories about PHREESIA INC that investors may wish to consider to help them evaluate PHR as an investment opportunity.
Does Phreesia (PHR) Have the Potential to Rally 30.09% as Wall Street Analysts Expect?The mean of analysts' price targets for Phreesia (PHR) points to a 30.1% upside in the stock. While this highly sought-after metric has not proven reasonably effective, strong agreement among analysts in raising earnings estimates does indicate an upside in the stock. |
What Caused a -40% Drop in Phreesia (PHR) Shares?TimesSquare Capital Management, an equity investment management company, released its “U.S. SMID Cap Growth Strategy” third-quarter investor letter. The same can be downloaded here. In the third quarter, the U.S. SMID Cap Growth Composite fell -2.65% (gross) and -2.89% (net) compared to the Russell 2500 Growth Index’s -6.84% decline. This quarter, the small-to-mid-cap growth stocks […] |
Phreesia, Inc.'s (NYSE:PHR) 43% Jump Shows Its Popularity With InvestorsPhreesia, Inc. ( NYSE:PHR ) shares have had a really impressive month, gaining 43% after a shaky period beforehand... |
Wall Street Analysts Predict a 77.77% Upside in Phreesia (PHR): Here's What You Should KnowThe mean of analysts' price targets for Phreesia (PHR) points to a 77.8% upside in the stock. While this highly sought-after metric has not proven reasonably effective, strong agreement among analysts in raising earnings estimates does indicate an upside in the stock. |
Phreesia, Inc. (NYSE:PHR) Q3 2024 Earnings Call TranscriptPhreesia, Inc. (NYSE:PHR) Q3 2024 Earnings Call Transcript December 5, 2023 Phreesia, Inc. beats earnings expectations. Reported EPS is $-0.25, expectations were $-0.72. Operator: Good evening, ladies and gentlemen, and welcome to the Phreesia Fiscal Third Quarter 2024 Earnings Conference Call. At this time, all participants are in a listen-only mode. [Operator Instructions]. First, I […] |
PHR Price Returns
| 1-mo | 13.68% |
| 3-mo | 20.18% |
| 6-mo | -1.90% |
| 1-year | -17.43% |
| 3-year | -63.11% |
| 5-year | -7.26% |
| YTD | 7.00% |
| 2023 | -28.46% |
| 2022 | -22.32% |
| 2021 | -23.22% |
| 2020 | 103.68% |
| 2019 | N/A |
Loading social stream, please wait...