
Impinj, Inc. (PI): Price and Financial Metrics
PI Price/Volume Stats
| Current price | $160.06 | 52-week high | $181.88 |
| Prev. close | $159.27 | 52-week low | $48.39 |
| Day low | $158.29 | Volume | 642,505 |
| Day high | $164.89 | Avg. volume | 439,601 |
| 50-day MA | $161.58 | Dividend yield | N/A |
| 200-day MA | $115.62 | Market Cap | 4.44B |
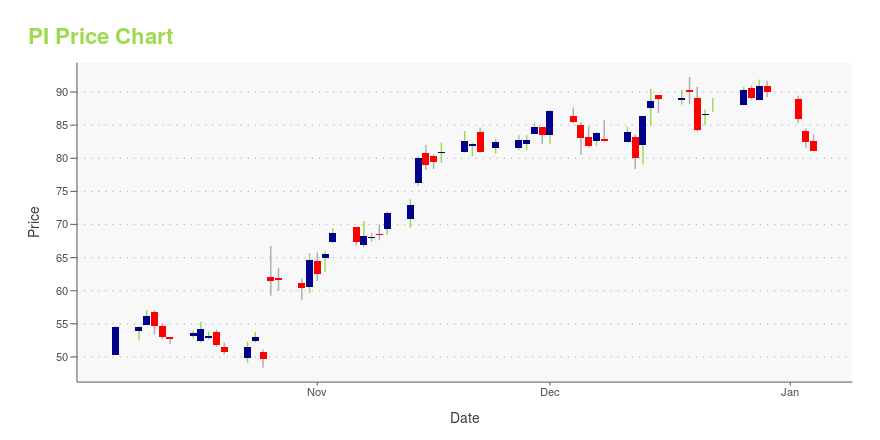
PI Stock Price Chart Interactive Chart >
Impinj, Inc. (PI) Company Bio
Impinj, Inc. provides ultra high frequency radio frequency identification (RFID) solutions for identifying, locating, and authenticating items. The company was founded in 2000 and is based in Seattle, Washington.
Latest PI News From Around the Web
Below are the latest news stories about IMPINJ INC that investors may wish to consider to help them evaluate PI as an investment opportunity.
Does Impinj (PI) have a Long-Term Growth Potential?Wasatch Global Investors, an investment management firm, released its “Wasatch Micro Cap Value Strategy” third quarter 2023 investor letter. A copy of the same can be downloaded here. The strategy outperformed its benchmark during the quarter. The quality-oriented positioning was the main reason for the strategy’s outperformance in the quarter. In addition, please check the fund’s […] |
How NXP Semiconductors Stock Rose 18% Last MonthNXP's stock rose for unexpected reasons in November. Spoiler alert: The jump involves a legal decision -- and not necessarily in this company's favor. |
Insider Sell Alert: CFO Cary Baker Sells Shares of Impinj IncImpinj Inc (NASDAQ:PI), a leading provider and innovator in RAIN RFID solutions, has recently seen a notable insider transaction. |
Sylebra Capital Ltd Bolsters Stake in Impinj IncOn November 14, 2023, Sylebra Capital Ltd (Trades, Portfolio) made a notable addition to its investment portfolio by acquiring 48,311 shares of Impinj Inc (NASDAQ:PI), a leading provider of RAIN RFID solutions. This transaction increased Sylebra Capital's holding to a total of 4,030,559 shares, marking a significant trade impact of 0.16% on its portfolio. This move adjusted Sylebra Capital's position in Impinj Inc to 13.12% of its portfolio, with a 14.89% stake in the company. |
New Impinj RAIN RFID Reader Delivers Edge Intelligence That Optimizes Speed and Automation in Supply Chain & LogisticsSEATTLE, November 13, 2023--Impinj R720 RAIN RFID reader delivers edge intelligence that optimizes speed and automation in supply chain and logistics. |
PI Price Returns
| 1-mo | 4.79% |
| 3-mo | 6.06% |
| 6-mo | 58.63% |
| 1-year | 131.23% |
| 3-year | 286.71% |
| 5-year | 342.77% |
| YTD | 77.79% |
| 2023 | -17.54% |
| 2022 | 23.09% |
| 2021 | 111.85% |
| 2020 | 61.91% |
| 2019 | 77.73% |
Continue Researching PI
Want to see what other sources are saying about Impinj Inc's financials and stock price? Try the links below:Impinj Inc (PI) Stock Price | Nasdaq
Impinj Inc (PI) Stock Quote, History and News - Yahoo Finance
Impinj Inc (PI) Stock Price and Basic Information | MarketWatch
Loading social stream, please wait...