
Polaris Industries Inc. (PII): Price and Financial Metrics
PII Price/Volume Stats
| Current price | $82.71 | 52-week high | $138.49 |
| Prev. close | $79.03 | 52-week low | $71.90 |
| Day low | $79.97 | Volume | 1,409,391 |
| Day high | $83.77 | Avg. volume | 790,399 |
| 50-day MA | $79.70 | Dividend yield | 3.38% |
| 200-day MA | $88.08 | Market Cap | 4.67B |
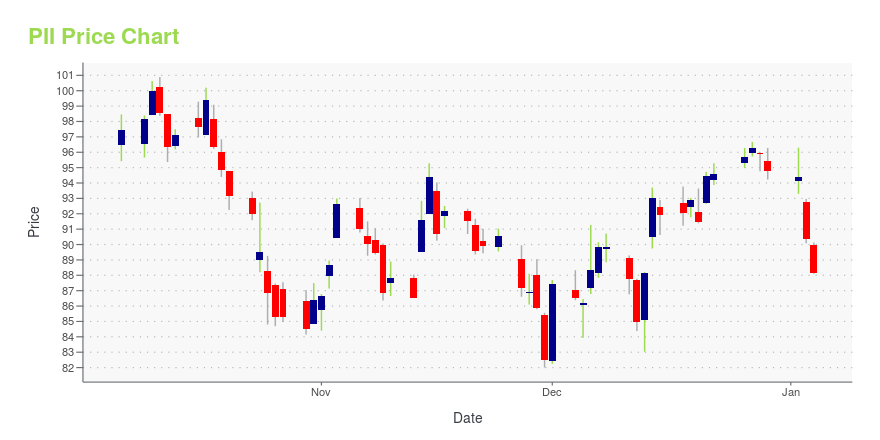
PII Stock Price Chart Interactive Chart >
Polaris Industries Inc. (PII) Company Bio
Polaris Industries designs, engineers, manufactures, and markets off-road vehicles, snowmobiles, motorcycles, and small vehicles primarily in the United States, Canada, Western Europe, Australia, and Mexico. The company was founded in 1987 and is based in Medina, Minnesota.
Latest PII News From Around the Web
Below are the latest news stories about POLARIS INC that investors may wish to consider to help them evaluate PII as an investment opportunity.
POLARIS OFF ROAD PARTNERS WITH SEBASTIEN LOEB RACING TO COMPETE IN THE 2024 DAKAR RALLY WITH RACE-READY RZR PRO R FACTORY MACHINESThe 46th Edition of the Dakar Rally kicks off on January 5, 2024 in Saudi Arabia, and today Polaris Off Road announced it is joining forces with Sebastien Loeb Racing (SLR), as SLR drivers Xavier de Soultrait and Florent Vayssade contest the SSV T4 category behind the wheel of Polaris' RZR Pro R Factory race machines. Backed by the full power and innovation of Polaris engineering, the SLR team is well-equipped to battle the unrelenting terrain of Dakar, where both man and machine will be pushed |
Polaris Schedules Fourth Quarter and Full Year 2023 Earnings Conference Call and WebcastPolaris Inc. (NYSE: PII) announced today that it will release its fourth quarter and full year 2023 financial results on Tuesday, January 30, 2024, and will hold a conference call and webcast at 10:00 AM central time on the same day to discuss the results. The call will be hosted by Mike Speetzen, Chief Executive Officer and Bob Mack, Chief Financial Officer. |
BENNINGTON LAUNCHES NEW APPAREL AND ACCESSORIES LINEBennington, North America's leading manufacturer of pontoon boats, has announced today the launch of an all-new apparel and accessories line designed specifically for owners wishing to elevate their experience and display their brand loyalty. Each item was developed to give boaters the opportunity to enjoy additional comfort and celebrate their Bennington lifestyle. With more than 100 new items, the product lineup includes apparel, hats, boating accessories, drinkware, coolers and more. |
1 Magnificent Dividend Stock Down 40% That You'll Wish You'd Bought at This Once-in-a-Decade ValuationThe market seems to want nothing to do with this stock -- and so now's the time to take a long look. |
Polaris Slingshot's New 2024 Model Year Lineup Delivers Extraordinary Driving Experiences & One-of-a-Kind On-Road AdventuresEmbraced by those who demand attention and appreciate its one-of-a-kind on-road adventure, the Polaris Slingshot is unlike anything else on the road. With an open cockpit, three-wheels, and bold, head-turning style, Slingshot serves as the ultimate platform for self-expression – driven by a diverse community of riders who dare to be different. |
PII Price Returns
| 1-mo | 5.90% |
| 3-mo | -0.53% |
| 6-mo | -8.10% |
| 1-year | -36.65% |
| 3-year | -32.02% |
| 5-year | 0.05% |
| YTD | -11.40% |
| 2023 | -3.79% |
| 2022 | -6.01% |
| 2021 | 17.75% |
| 2020 | -3.78% |
| 2019 | 36.37% |
PII Dividends
| Ex-Dividend Date | Type | Payout Amount | Change | ||||||
|---|---|---|---|---|---|---|---|---|---|
| Loading, please wait... | |||||||||
Continue Researching PII
Want to see what other sources are saying about Polaris Inc's financials and stock price? Try the links below:Polaris Inc (PII) Stock Price | Nasdaq
Polaris Inc (PII) Stock Quote, History and News - Yahoo Finance
Polaris Inc (PII) Stock Price and Basic Information | MarketWatch
Loading social stream, please wait...