
PJT Partners Inc. (PJT): Price and Financial Metrics
PJT Price/Volume Stats
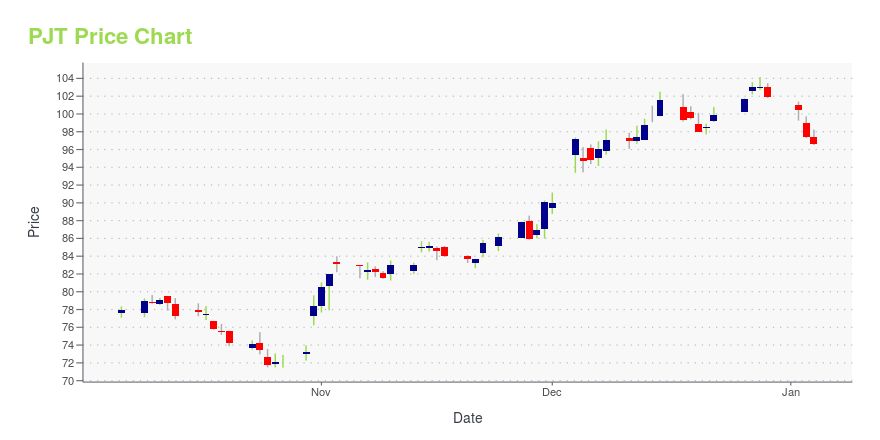
| Current price | $126.38 | 52-week high | $128.11 |
| Prev. close | $124.50 | 52-week low | $71.47 |
| Day low | $124.99 | Volume | 260,800 |
| Day high | $128.11 | Avg. volume | 251,310 |
| 50-day MA | $109.00 | Dividend yield | 0.82% |
| 200-day MA | $97.34 | Market Cap | 3.03B |
PJT Stock Price Chart Interactive Chart >
PJT Partners Inc. (PJT) Company Bio
PJT Partners Inc. offers strategic advisory, mergers and acquisitions, restructuring and reorganization, and funds advisory services to corporations, financial sponsors, institutional investors, and governments. The company was spun out of the Blackstone Group in 2015 and is based in New York City, New York.
Latest PJT News From Around the Web
Below are the latest news stories about PJT PARTNERS INC that investors may wish to consider to help them evaluate PJT as an investment opportunity.
S&P 500’s Latest Roster Updates: The Top 3 New Faces to Invest in NowThe rebalancing for the S&P 500 and its mid-cap and small-cap stablemates occurred on Dec. |
Uber Technologies, Jabil and Builders FirstSource Set to Join S&P 500; Others to Join S&P MidCap 400 and S&P SmallCap 600S&P Dow Jones Indices ("S&P DJI") will make the following changes to the S&P 500, S&P MidCap 400, and S&P SmallCap 600 indices effective prior to the open of trading on Monday, December 18, to coincide with the quarterly rebalance. The changes ensure each index is more representative of its market capitalization range. All companies being added to the S&P 500 are more representative of the large-cap market space, all companies being added to the S&P MidCap 400 are more representative of the mid- |
Be Sure To Check Out PJT Partners Inc. (NYSE:PJT) Before It Goes Ex-DividendRegular readers will know that we love our dividends at Simply Wall St, which is why it's exciting to see PJT Partners... |
PJT Partners (NYSE:PJT) Is Paying Out A Dividend Of $0.25PJT Partners Inc. ( NYSE:PJT ) will pay a dividend of $0.25 on the 20th of December. Including this payment, the... |
PJT Partners Inc. to Present at the Goldman Sachs 2023 Financial Services Conference on December 6NEW YORK, November 21, 2023--PJT Partners Inc. ("PJT Partners") (NYSE:PJT) announced that its Chairman and Chief Executive Officer, Paul J. Taubman, is scheduled to present at the Goldman Sachs 2023 Financial Services Conference on Wednesday, December 6, 2023 at 11:20 a.m. ET. |
PJT Price Returns
| 1-mo | 20.36% |
| 3-mo | 34.63% |
| 6-mo | 31.13% |
| 1-year | 63.07% |
| 3-year | 81.10% |
| 5-year | 270.85% |
| YTD | 24.65% |
| 2023 | 40.00% |
| 2022 | 0.92% |
| 2021 | 2.62% |
| 2020 | 67.34% |
| 2019 | 17.00% |
PJT Dividends
| Ex-Dividend Date | Type | Payout Amount | Change | ||||||
|---|---|---|---|---|---|---|---|---|---|
| Loading, please wait... | |||||||||
Continue Researching PJT
Want to see what other sources are saying about PJT Partners Inc's financials and stock price? Try the links below:PJT Partners Inc (PJT) Stock Price | Nasdaq
PJT Partners Inc (PJT) Stock Quote, History and News - Yahoo Finance
PJT Partners Inc (PJT) Stock Price and Basic Information | MarketWatch
Loading social stream, please wait...