
Park Hotels & Resorts Inc. (PK): Price and Financial Metrics
PK Price/Volume Stats
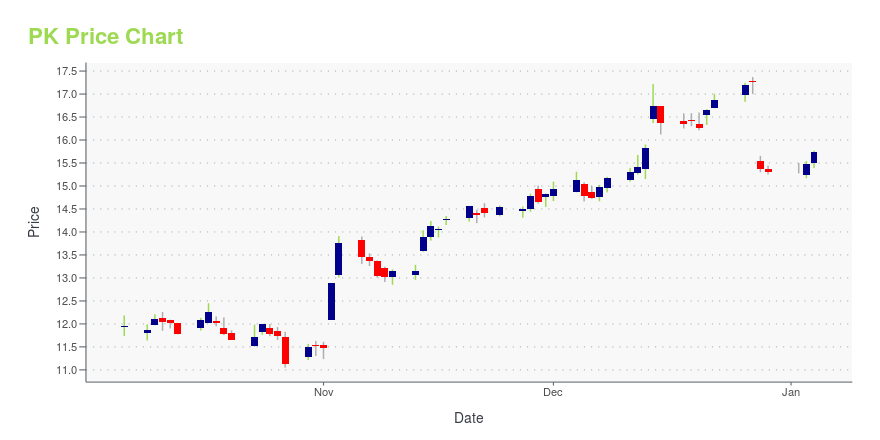
| Current price | $14.93 | 52-week high | $18.05 |
| Prev. close | $14.52 | 52-week low | $11.05 |
| Day low | $14.67 | Volume | 2,695,695 |
| Day high | $15.00 | Avg. volume | 2,722,458 |
| 50-day MA | $15.13 | Dividend yield | 6.61% |
| 200-day MA | $15.37 | Market Cap | 3.14B |
PK Stock Price Chart Interactive Chart >
Park Hotels & Resorts Inc. (PK) Company Bio
Park Hotels & Resorts Inc. was established as an independent company on January 3, 2017, following its spin-off from Hilton Worldwide Holdings, Inc. The company is a lodging real estate company with its portfolio consists of approximately 67 premium-branded hotels and resorts with over 35,000 rooms located in prime United States and internationally. Over 85% of Park’s portfolio is in the luxury or upper upscale segment and 100% is in the U.S., including locations in 14 of the top 25 markets. Nearly 80% of the company’s portfolio is in the central business districts of major cities or resort or conference destinations. Thomas J. Baltimore, Jr. serves as Park’s President and Chief Executive Officer and the company has approximately 500 employees.
Latest PK News From Around the Web
Below are the latest news stories about PARK HOTELS & RESORTS INC that investors may wish to consider to help them evaluate PK as an investment opportunity.
Hotel REITs 2024: Golden Opportunity Or Fool's Gold?As 2023 nears completion, investors in real estate investment trusts (REITs) are feeling more optimistic. After a prolonged slump throughout 2022 and the first 10 months of 2023, REITs have rallied over the past two months. Pauses in interest rate hikes, along with the likelihood of three interest rate cuts in 2024, have generated strong appreciation of REITs across multiple subsectors. As investors look toward 2024, they will be forced to differentiate between REITs that will likely continue ma |
5 REITs Paying Special Dividends With Upcoming Ex-Dividend DatesAs much as investors love regular dividend payments, it's even more "special" when one of their stocks pays a special dividend, most often at the end of the calendar year. Because real estate investment trusts (REITs) are required to pay shareholders 90% or more of taxable income each year, special dividend distributions are often required when a REIT disposes of assets with large gains, which increases the taxable income for that year. The special dividend benefits shareholders with a larger an |
Park Hotels' (PK) Portfolio Sees Robust Q4 Operating TrendsPark Hotels' (PK) fourth-quarter operating trend remains robust, aided by a strong performance in the urban portfolio. |
Zacks.com featured highlights Park Hotels & Resorts, Centene, Solo Brands and AZZPark Hotels & Resorts, Centene, Solo Brands and AZZ have been highlighted in this Screen of The Week article. |
4 Low Price-to-Cash Flow Stocks to Navigate the Market in 2024Value investing is essentially about selecting stocks that are usually cheap but fundamentally sound. Park Hotels & Resorts (PK), Centene (CNC), Solo Brands (DTC) and AZZ Inc. (AZZ) boast low P/CF ratios. |
PK Price Returns
| 1-mo | 3.23% |
| 3-mo | -8.36% |
| 6-mo | -0.93% |
| 1-year | 37.54% |
| 3-year | -3.23% |
| 5-year | -24.42% |
| YTD | 0.69% |
| 2023 | 49.45% |
| 2022 | -36.03% |
| 2021 | 10.09% |
| 2020 | -30.13% |
| 2019 | 6.86% |
PK Dividends
| Ex-Dividend Date | Type | Payout Amount | Change | ||||||
|---|---|---|---|---|---|---|---|---|---|
| Loading, please wait... | |||||||||
Continue Researching PK
Want to do more research on Park Hotels & Resorts Inc's stock and its price? Try the links below:Park Hotels & Resorts Inc (PK) Stock Price | Nasdaq
Park Hotels & Resorts Inc (PK) Stock Quote, History and News - Yahoo Finance
Park Hotels & Resorts Inc (PK) Stock Price and Basic Information | MarketWatch
Loading social stream, please wait...