
Park Aerospace Corp. (PKE): Price and Financial Metrics
PKE Price/Volume Stats
| Current price | $13.31 | 52-week high | $16.96 |
| Prev. close | $12.83 | 52-week low | $12.75 |
| Day low | $12.75 | Volume | 114,242 |
| Day high | $13.32 | Avg. volume | 61,760 |
| 50-day MA | $13.67 | Dividend yield | 3.77% |
| 200-day MA | $14.62 | Market Cap | 269.57M |
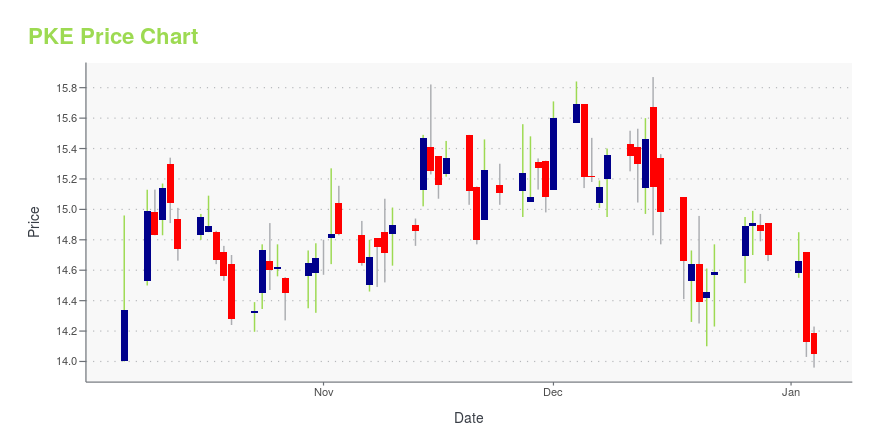
PKE Stock Price Chart Interactive Chart >
Park Aerospace Corp. (PKE) Company Bio
Park Electrochemical Corp., through its subsidiaries, develops, manufactures, markets, and sells high-technology digital and radio frequency/microwave printed circuit material products primarily for the telecommunications, Internet infrastructure, and high-end computing markets. The company was founded in 1954 and is based in Melville, New York.
Latest PKE News From Around the Web
Below are the latest news stories about PARK AEROSPACE CORP that investors may wish to consider to help them evaluate PKE as an investment opportunity.
Park Aerospace Corp. Declares Cash DividendNEWTON, Kan., Dec. 11, 2023 (GLOBE NEWSWIRE) -- The Board of Directors of Park Aerospace Corp. (NYSE – PKE) has declared a regular quarterly dividend of $0.125 per share payable February 2, 2024 to shareholders of record at the close of business on January 3, 2024. Park has paid 38 consecutive years of uninterrupted regular, quarterly cash dividends, without ever skipping a dividend payment or reducing the amount of the dividend. The Company has paid approximately $588 million in cash dividends, |
Investing in Park Aerospace (NYSE:PKE) five years ago would have delivered you a 37% gainIn order to justify the effort of selecting individual stocks, it's worth striving to beat the returns from a market... |
Should You Be Adding Park Aerospace (NYSE:PKE) To Your Watchlist Today?Investors are often guided by the idea of discovering 'the next big thing', even if that means buying 'story stocks... |
Park Aerospace Corp. (NYSE:PKE) is favoured by institutional owners who hold 79% of the companyKey Insights Given the large stake in the stock by institutions, Park Aerospace's stock price might be vulnerable to... |
There's Been No Shortage Of Growth Recently For Park Aerospace's (NYSE:PKE) Returns On CapitalWhat are the early trends we should look for to identify a stock that could multiply in value over the long term? In a... |
PKE Price Returns
| 1-mo | 0.62% |
| 3-mo | -8.99% |
| 6-mo | -13.74% |
| 1-year | -4.25% |
| 3-year | 6.84% |
| 5-year | 2.77% |
| YTD | -7.14% |
| 2023 | 21.52% |
| 2022 | 4.89% |
| 2021 | 0.57% |
| 2020 | -9.57% |
| 2019 | 13.19% |
PKE Dividends
| Ex-Dividend Date | Type | Payout Amount | Change | ||||||
|---|---|---|---|---|---|---|---|---|---|
| Loading, please wait... | |||||||||
Continue Researching PKE
Want to see what other sources are saying about Park Aerospace Corp's financials and stock price? Try the links below:Park Aerospace Corp (PKE) Stock Price | Nasdaq
Park Aerospace Corp (PKE) Stock Quote, History and News - Yahoo Finance
Park Aerospace Corp (PKE) Stock Price and Basic Information | MarketWatch
Loading social stream, please wait...