Photronics, Inc. (PLAB): Price and Financial Metrics
PLAB Price/Volume Stats
Current price | $21.19 | 52-week high | $26.98 |
Prev. close | $21.13 | 52-week low | $13.86 |
Day low | $20.81 | Volume | 312,900 |
Day high | $21.27 | Avg. volume | 549,404 |
50-day MA | $20.15 | Dividend yield | N/A |
200-day MA | $20.18 | Market Cap | 1.33B |
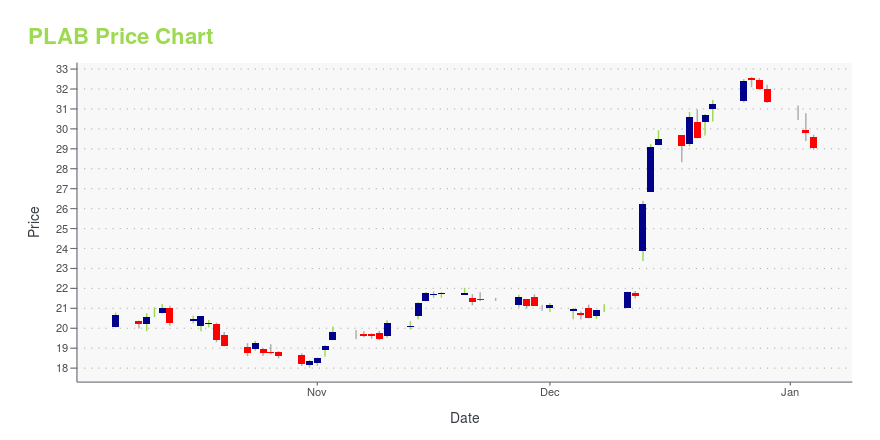
PLAB Stock Price Chart Interactive Chart >
PLAB POWR Grades
- Momentum is the dimension where PLAB ranks best; there it ranks ahead of 99.44% of US stocks.
- The strongest trend for PLAB is in Growth, which has been heading down over the past 177 days.
- PLAB ranks lowest in Growth; there it ranks in the 15th percentile.
PLAB Stock Summary
- PHOTRONICS INC's stock had its IPO on March 26, 1990, making it an older stock than 85.3% of US equities in our set.
- Price to trailing twelve month operating cash flow for PLAB is currently 4.61, higher than just 21.92% of US stocks with positive operating cash flow.
- With a year-over-year growth in debt of -53.4%, PHOTRONICS INC's debt growth rate surpasses only 5.1% of about US stocks.
- Stocks with similar financial metrics, market capitalization, and price volatility to PHOTRONICS INC are EAR, HEAR, ECOR, LNN, and MYSZ.
- PLAB's SEC filings can be seen here. And to visit PHOTRONICS INC's official web site, go to www.photronics.com.
PLAB Valuation Summary
- PLAB's price/sales ratio is 1.4; this is 36.36% lower than that of the median Technology stock.
- PLAB's price/sales ratio has moved down 0.6 over the prior 243 months.
Below are key valuation metrics over time for PLAB.
Stock | Date | P/S | P/B | P/E | EV/EBIT |
---|---|---|---|---|---|
PLAB | 2023-11-03 | 1.4 | 1.3 | 10.5 | 4.4 |
PLAB | 2023-11-02 | 1.4 | 1.2 | 10.1 | 4.2 |
PLAB | 2023-11-01 | 1.3 | 1.2 | 9.8 | 4.0 |
PLAB | 2023-10-31 | 1.3 | 1.2 | 9.7 | 3.9 |
PLAB | 2023-10-30 | 1.3 | 1.2 | 9.7 | 3.9 |
PLAB | 2023-10-27 | 1.3 | 1.2 | 9.9 | 4.0 |
PLAB Growth Metrics
- The 3 year price growth rate now stands at 149.28%.
- Its year over year price growth rate is now at 58.12%.
- Its 5 year net cashflow from operations growth rate is now at 27.04%.

The table below shows PLAB's growth in key financial areas (numbers in millions of US dollars).
Date | Revenue | Operating Cash Flow | Net Income to Common Stock |
---|---|---|---|
2022-09-30 | 824.549 | 275.187 | 118.786 |
2022-06-30 | 795.572 | 233.597 | 101.537 |
2022-03-31 | 746.267 | 195.842 | 87.383 |
2021-12-31 | 701.521 | 183.615 | 70.477 |
2021-09-30 | 663.761 | 150.772 | 55.449 |
2021-06-30 | 631.759 | 177.878 | 42.098 |
PLAB's Quality Factors
The “Quality” component of the POWR Ratings focuses on 31 different factors of a companies fundamentals and operational strength. Here are some key insights as we drill into the specifics of these quality attributes.- PLAB has a Quality Grade of C, ranking ahead of 53.07% of graded US stocks.
- PLAB's asset turnover comes in at 0.509 -- ranking 138th of 208 Electronic Equipment stocks.
- CETX, IPGP, and AXTI are the stocks whose asset turnover ratios are most correlated with PLAB.
The table below shows PLAB's key quality metrics over time.
Period | Asset Turnover | Gross Margin | ROIC |
---|---|---|---|
2021-08-01 | 0.509 | 0.233 | 0.067 |
2021-05-02 | 0.507 | 0.225 | 0.059 |
2021-01-31 | 0.507 | 0.217 | 0.058 |
2020-10-31 | 0.525 | 0.221 | 0.071 |
2020-08-02 | 0.539 | 0.229 | 0.074 |
2020-05-03 | 0.531 | 0.224 | 0.066 |
PLAB Price Target
For more insight on analysts targets of PLAB, see our PLAB price target page. And for a list of of all stocks sorted by upside potential based on analyst target price, see our Top Price Target page.
Average Price Target | $18.00 | Average Broker Recommendation | 1.67 (Moderate Buy) |
Photronics, Inc. (PLAB) Company Bio
Photronics Inc. offers services across the full spectrum of integrated chip production and flat panel display technologies by manufacturing photomasks using electron beam or optical (laser-based) systems. The company was founded in 1969 and is based in Brookfield, Connecticut.
Latest PLAB News From Around the Web
Below are the latest news stories about PHOTRONICS INC that investors may wish to consider to help them evaluate PLAB as an investment opportunity.
Photronics (PLAB) Flat As Market Gains: What You Should KnowPhotronics (PLAB) reachead $21.75 at the closing of the latest trading day, reflecting no change compared to its last close. |
Photronics Stock Up 45% Since April: One To WatchSemiconductor equipment maker Photronics had its Relative Strength (RS) Rating upgraded from 70 to 82 Monday, a significant upgrade. The raised 82 Relative Strength Rating shows that Photronics tops 81% of all stock for price strength over the past year. Among its other key ratings Photronics stock has an 89 Composite Rating, out of 99. |
Photronics (PLAB) Suffers a Larger Drop Than the General Market: Key InsightsIn the most recent trading session, Photronics (PLAB) closed at $20.11, indicating a -0.64% shift from the previous trading day. |
Top 11 Extreme Value Stocks To BuyIn this article, we discuss the top 11 extreme value stocks to buy. To skip the detailed analysis and performance history of value stocks, go directly to the Top 5 Extreme Value Stocks To Buy. Value investing is an investment strategy that aims to find stocks that the market underestimates and are trading below their […] |
The Tech Stocks That Will Eventually Become the New Magnificent SevenThe future Magnificent Seven stocks are probably not on your radar. |
PLAB Price Returns
1-mo | 6.91% |
3-mo | N/A |
6-mo | -5.61% |
1-year | 13.38% |
3-year | 72.84% |
5-year | 126.63% |
YTD | 25.91% |
2022 | -10.72% |
2021 | 68.91% |
2020 | -29.19% |
2019 | 62.81% |
2018 | 13.55% |
Continue Researching PLAB
Want to see what other sources are saying about Photronics Inc's financials and stock price? Try the links below:Photronics Inc (PLAB) Stock Price | Nasdaq
Photronics Inc (PLAB) Stock Quote, History and News - Yahoo Finance
Photronics Inc (PLAB) Stock Price and Basic Information | MarketWatch
Loading social stream, please wait...