Dave & Buster's Entertainment Inc. (PLAY): Price and Financial Metrics
GET POWR RATINGS... FREE!
PLAY POWR Grades
- Growth is the dimension where PLAY ranks best; there it ranks ahead of 74.99% of US stocks.
- PLAY's strongest trending metric is Growth; it's been moving up over the last 179 days.
- PLAY's current lowest rank is in the Stability metric (where it is better than 12.38% of US stocks).
PLAY Stock Summary
- The capital turnover (annual revenue relative to shareholder's equity) for PLAY is 4.83 -- better than 90.48% of US stocks.
- Of note is the ratio of DAVE & BUSTER'S ENTERTAINMENT INC's sales and general administrative expense to its total operating expenses; merely 3.59% of US stocks have a lower such ratio.
- Over the past twelve months, PLAY has reported earnings growth of 171.69%, putting it ahead of 91.38% of US stocks in our set.
- Stocks with similar financial metrics, market capitalization, and price volatility to DAVE & BUSTER'S ENTERTAINMENT INC are DINO, ADV, SNDR, RLGT, and ENLC.
- Visit PLAY's SEC page to see the company's official filings. To visit the company's web site, go to ir.daveandbusters.com.
PLAY Valuation Summary
- In comparison to the median Consumer Cyclical stock, PLAY's price/sales ratio is 12.5% higher, now standing at 0.9.
- PLAY's EV/EBIT ratio has moved down 3.1 over the prior 103 months.
Below are key valuation metrics over time for PLAY.
Stock | Date | P/S | P/B | P/E | EV/EBIT |
---|---|---|---|---|---|
PLAY | 2023-03-17 | 0.9 | 4.6 | 13.4 | 19.2 |
PLAY | 2023-03-16 | 1.0 | 4.7 | 13.7 | 19.4 |
PLAY | 2023-03-15 | 0.9 | 4.5 | 13.3 | 19.1 |
PLAY | 2023-03-14 | 0.9 | 4.5 | 13.2 | 19.0 |
PLAY | 2023-03-13 | 0.9 | 4.6 | 13.3 | 19.1 |
PLAY | 2023-03-10 | 1.0 | 4.8 | 14.0 | 19.5 |
PLAY Growth Metrics
- Its 2 year price growth rate is now at 385.59%.
- Its 4 year price growth rate is now at -83.6%.
- Its 5 year price growth rate is now at -83.6%.

The table below shows PLAY's growth in key financial areas (numbers in millions of US dollars).
Date | Revenue | Operating Cash Flow | Net Income to Common Stock |
---|---|---|---|
2022-12-31 | 1,743.768 | 385.595 | 123.64 |
2022-09-30 | 1,580.538 | 318.097 | 132.307 |
2022-06-30 | 1,489.817 | 354.526 | 155.989 |
2022-03-31 | 1,304.056 | 283.128 | 108.64 |
2021-12-31 | 1,077.775 | 181.028 | 26.205 |
2021-09-30 | 868.851 | 162.368 | -32.423 |
PLAY's Quality Factors
The “Quality” component of the POWR Ratings focuses on 31 different factors of a companies fundamentals and operational strength. Here are some key insights as we drill into the specifics of these quality attributes.- PLAY has a Quality Grade of C, ranking ahead of 69.11% of graded US stocks.
- PLAY's asset turnover comes in at 0.368 -- ranking 55th of 79 Restaraunts Hotels Motels stocks.
- TXRH, CAKE, and CHUY are the stocks whose asset turnover ratios are most correlated with PLAY.
The table below shows PLAY's key quality metrics over time.
Period | Asset Turnover | Gross Margin | ROIC |
---|---|---|---|
2021-08-01 | 0.368 | 0.844 | 0.001 |
2021-05-02 | 0.224 | 0.840 | -0.043 |
2021-01-31 | 0.176 | 0.828 | -0.069 |
2020-11-01 | 0.268 | 0.828 | -0.044 |
2020-08-02 | 0.348 | 0.826 | -0.027 |
2020-05-03 | 0.486 | 0.827 | 0.008 |
PLAY Price Target
For more insight on analysts targets of PLAY, see our PLAY price target page. And for a list of of all stocks sorted by upside potential based on analyst target price, see our Top Price Target page.
Average Price Target | $49.56 | Average Broker Recommendation | 1.59 (Moderate Buy) |
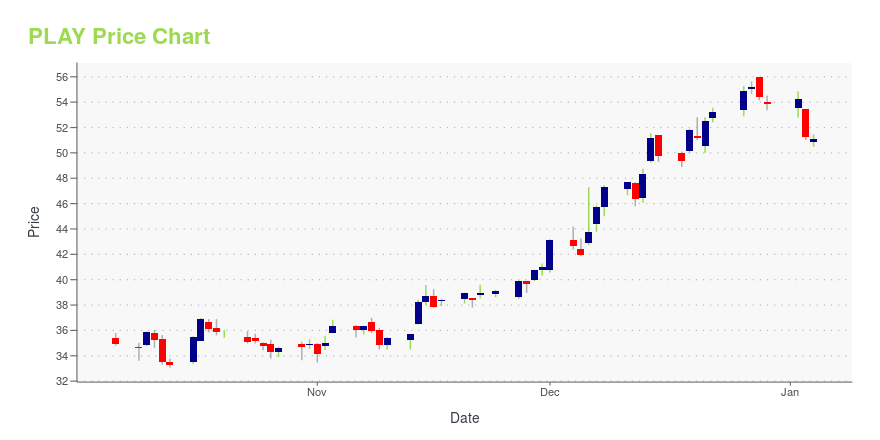
PLAY Stock Price Chart Interactive Chart >
PLAY Price/Volume Stats
Current price | $36.04 | 52-week high | $52.54 |
Prev. close | $36.23 | 52-week low | $29.60 |
Day low | $35.90 | Volume | 691,300 |
Day high | $37.12 | Avg. volume | 996,131 |
50-day MA | $40.64 | Dividend yield | N/A |
200-day MA | $37.63 | Market Cap | 1.74B |
Dave & Buster's Entertainment Inc. (PLAY) Company Bio
Dave & Buster's Entertainment Inc is an owner and operator of high-volume venues that combine dining and entertainment in North America for both adults and families. The company was founded by Davide Corriveau and James “Buster” Corley and the pair opened their first establishment in Dallas in 1982. Each venue offers a wide variety of arcade, video, and virtual reality games combined with dining choices ranging from wings to steaks. Dave and Buster’s has over 110 locations across the country and Brian A. Jenkins serves as the company’s Chief Executive Officer.
Latest PLAY News From Around the Web
Below are the latest news stories about DAVE & BUSTER'S ENTERTAINMENT INC that investors may wish to consider to help them evaluate PLAY as an investment opportunity.
Is Dave & Buster's Entertainment, Inc.'s (NASDAQ:PLAY) ROE Of 34% Impressive?One of the best investments we can make is in our own knowledge and skill set. With that in mind, this article will... |
Dave & Buster’s Entertainment, Inc. to Report Fourth Quarter and Fiscal Year End 2022 Financial Results on March 28, 2023DALLAS, March 14, 2023 (GLOBE NEWSWIRE) -- Dave & Buster's Entertainment, Inc., (NASDAQ:PLAY), ("Dave & Buster's" or "the Company"), an owner and operator of entertainment and dining venues, today announced that it will report financial results for its fourth quarter and fiscal year ended January 29, 2023 after the market closes on Tuesday, March 28, 2023. Management will hold a conference call to review the results the same day at 4:00 p.m. Central Time (5:00 p.m. Eastern Time). Participants ca |
Here's Why Investors Should Retain Dave & Buster's (PLAY) StockDave & Buster's (PLAY) focuses on broadening its entertainment offerings to drive growth. However, inflationary pressures are a concern. |
Potbelly (PBPB) Q4 Earnings Miss EstimatesPotbelly (PBPB) delivered earnings and revenue surprises of -30.77% and 0.97%, respectively, for the quarter ended December 2022. Do the numbers hold clues to what lies ahead for the stock? |
Estimating The Intrinsic Value Of Dave & Buster's Entertainment, Inc. (NASDAQ:PLAY)Does the February share price for Dave & Buster's Entertainment, Inc. ( NASDAQ:PLAY ) reflect what it's really worth... |
PLAY Price Returns
1-mo | -11.88% |
3-mo | 3.00% |
6-mo | 11.79% |
1-year | -18.77% |
3-year | 261.85% |
5-year | -11.69% |
YTD | 1.69% |
2022 | -7.71% |
2021 | 27.91% |
2020 | -24.97% |
2019 | -8.87% |
2018 | -18.76% |
Continue Researching PLAY
Want to do more research on Dave & Buster's Entertainment Inc's stock and its price? Try the links below:Dave & Buster's Entertainment Inc (PLAY) Stock Price | Nasdaq
Dave & Buster's Entertainment Inc (PLAY) Stock Quote, History and News - Yahoo Finance
Dave & Buster's Entertainment Inc (PLAY) Stock Price and Basic Information | MarketWatch
Loading social stream, please wait...