
Prologis Inc. (PLD): Price and Financial Metrics
PLD Price/Volume Stats
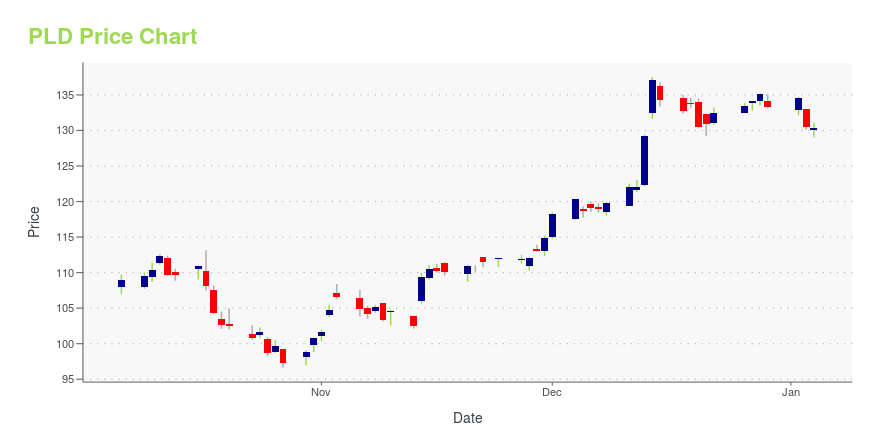
| Current price | $122.68 | 52-week high | $137.52 |
| Prev. close | $120.43 | 52-week low | $96.64 |
| Day low | $120.39 | Volume | 3,374,108 |
| Day high | $123.27 | Avg. volume | 3,756,973 |
| 50-day MA | $113.46 | Dividend yield | 3.06% |
| 200-day MA | $118.59 | Market Cap | 113.58B |
PLD Stock Price Chart Interactive Chart >
Prologis Inc. (PLD) Company Bio
Prologis, Inc. is a real estate investment trust headquartered in San Francisco, California that invests in logistics facilities, with a focus on the consumption side of the global supply chain. The company was formed through the merger of AMB Property Corporation and ProLogis in June 2011, which made Prologis the largest industrial real estate company in the world. As of December 31, 2020, the company owned 4,703 buildings comprising 984 million square feet in 19 countries in North America, Latin America, Europe, and Asia. According to The Economist, its business strategy is focused on warehouses that are located close to huge urban areas where land is scarce. It serves over 5,000 tenants. Prologis created a venture capital arm in 2016. (Source:Wikipedia)
Latest PLD News From Around the Web
Below are the latest news stories about PROLOGIS INC that investors may wish to consider to help them evaluate PLD as an investment opportunity.
Prologis to Announce Fourth Quarter 2023 Results January 17Prologis, Inc. (NYSE: PLD), the global leader in logistics real estate, will host a webcast and conference call with senior management to discuss fourth quarter results, current market conditions and future outlook on Wednesday, January 17, 2024, at 9:00 a.m. PT/12:00 p.m. ET. |
Investing in REITs: One stock to buy and one to avoidReal Estate Investment Trusts or REITs have been hit by issues such as high interest rates, lackluster return to office, and overall concerns about an economic slowdown. Infrastructure Capital Advisors CEO Jay Hatfield gives his take on the space in the latest Good Buy or Goodbye. Hatfield is buying Boston Properties (BXP) because he believes the stock will rally as interest rates fall and that it has an attractive valuation. He also likes the stock because, even though they do have office properties, Hatfield says they tend to cater to sectors that favor work from the office. A stock Hatfield is avoiding is Prologis (PLD), which owns warehouses. Hatfield says that, unlike office space, warehouse space is "easy to replicate," which means there is a lot of new space coming online. Hatfie... |
The Smartest Dividend Stocks to Buy With $400 Right NowThese dividend stocks could deliver market-beating total returns in the coming years. |
Is Stag Industrial Stock a Buy?Up around 20% in 2023 thus far, is this industrial REIT worth adding to your portfolio today? The answer isn't exactly an obvious yes or no. |
Why Prologis (PLD) is a Top Stock for the Long-TermThe Zacks Focus List offers investors a way to easily find top-rated stocks and build a winning investment portfolio. Here's why you should take advantage. |
PLD Price Returns
| 1-mo | 11.11% |
| 3-mo | 18.91% |
| 6-mo | -1.75% |
| 1-year | 1.12% |
| 3-year | 2.64% |
| 5-year | 69.68% |
| YTD | -6.49% |
| 2023 | 21.58% |
| 2022 | -31.33% |
| 2021 | 72.33% |
| 2020 | 14.74% |
| 2019 | 55.87% |
PLD Dividends
| Ex-Dividend Date | Type | Payout Amount | Change | ||||||
|---|---|---|---|---|---|---|---|---|---|
| Loading, please wait... | |||||||||
Continue Researching PLD
Want to do more research on Prologis Inc's stock and its price? Try the links below:Prologis Inc (PLD) Stock Price | Nasdaq
Prologis Inc (PLD) Stock Quote, History and News - Yahoo Finance
Prologis Inc (PLD) Stock Price and Basic Information | MarketWatch
Loading social stream, please wait...