Pulse Biosciences, Inc (PLSE): Price and Financial Metrics
PLSE Price/Volume Stats
Current price | $6.20 | 52-week high | $9.69 |
Prev. close | $5.97 | 52-week low | $1.18 |
Day low | $5.91 | Volume | 74,023 |
Day high | $6.58 | Avg. volume | 88,404 |
50-day MA | $5.70 | Dividend yield | N/A |
200-day MA | $3.20 | Market Cap | 233.38M |
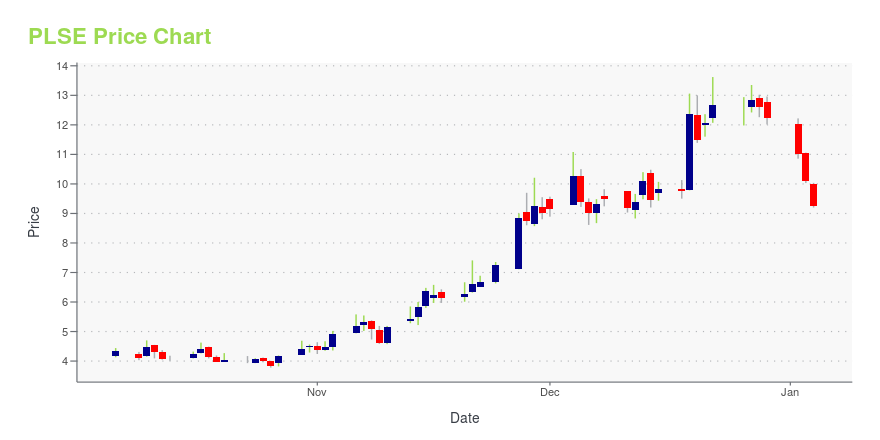
PLSE Stock Price Chart Interactive Chart >
PLSE POWR Grades
- PLSE scores best on the Growth dimension, with a Growth rank ahead of 79.35% of US stocks.
- The strongest trend for PLSE is in Growth, which has been heading up over the past 179 days.
- PLSE's current lowest rank is in the Value metric (where it is better than 3.08% of US stocks).
PLSE Stock Summary
- PLSE's price/sales ratio is 867.53; that's higher than the P/S ratio of 99.41% of US stocks.
- With a year-over-year growth in debt of 611.38%, PULSE BIOSCIENCES INC's debt growth rate surpasses 97.4% of about US stocks.
- As for revenue growth, note that PLSE's revenue has grown -86.25% over the past 12 months; that beats the revenue growth of only 1.73% of US companies in our set.
- Stocks with similar financial metrics, market capitalization, and price volatility to PULSE BIOSCIENCES INC are INFN, TSHA, TVTX, WATT, and GH.
- PLSE's SEC filings can be seen here. And to visit PULSE BIOSCIENCES INC's official web site, go to www.pulsebiosciences.com.
PLSE Valuation Summary
- In comparison to the median Healthcare stock, PLSE's price/earnings ratio is 119.09% lower, now standing at -4.6.
- PLSE's price/earnings ratio has moved up 14 over the prior 85 months.
Below are key valuation metrics over time for PLSE.
Stock | Date | P/S | P/B | P/E | EV/EBIT |
---|---|---|---|---|---|
PLSE | 2023-05-23 | 923.4 | -22.2 | -4.6 | -5.1 |
PLSE | 2023-05-22 | 920.3 | -22.1 | -4.6 | -5.1 |
PLSE | 2023-05-19 | 1000.0 | -24.0 | -5.0 | -5.5 |
PLSE | 2023-05-18 | 1064.5 | -25.5 | -5.3 | -5.8 |
PLSE | 2023-05-17 | 1129.3 | -27.1 | -5.7 | -6.2 |
PLSE | 2023-05-16 | 1164.5 | -27.9 | -5.8 | -6.3 |
PLSE Growth Metrics
- Its 4 year price growth rate is now at -44.04%.
- Its 5 year net income to common stockholders growth rate is now at -342.03%.
- Its 3 year net income to common stockholders growth rate is now at -59.91%.

The table below shows PLSE's growth in key financial areas (numbers in millions of US dollars).
Date | Revenue | Operating Cash Flow | Net Income to Common Stock |
---|---|---|---|
2022-09-30 | 1.553 | -51.742 | -64.724 |
2022-06-30 | 2.127 | -54.46 | -60.967 |
2022-03-31 | 1.862 | -58.004 | -62.294 |
2021-12-31 | 1.418 | -54.097 | -63.66 |
2021-09-30 | 0.574 | -50.658 | -61.994 |
2021-06-30 | 0 | -45.857 | -60.608 |
PLSE's Quality Factors
The “Quality” component of the POWR Ratings focuses on 31 different factors of a companies fundamentals and operational strength. Here are some key insights as we drill into the specifics of these quality attributes.- PLSE has a Quality Grade of D, ranking ahead of 20.2% of graded US stocks.
- PLSE's asset turnover comes in at 0 -- ranking 171st of 186 Medical Equipment stocks.
- BBLG, SNN, and EYE are the stocks whose asset turnover ratios are most correlated with PLSE.
The table below shows PLSE's key quality metrics over time.
Period | Asset Turnover | Gross Margin | ROIC |
---|---|---|---|
2021-06-30 | 0 | NA | -1.553 |
2021-03-31 | 0 | NA | -1.555 |
2020-12-31 | 0 | NA | -1.854 |
2020-09-30 | 0 | NA | -1.789 |
2020-06-30 | 0 | NA | -1.916 |
2020-03-31 | 0 | NA | -1.617 |
PLSE Price Target
For more insight on analysts targets of PLSE, see our PLSE price target page. And for a list of of all stocks sorted by upside potential based on analyst target price, see our Top Price Target page.
Average Price Target | $38.00 | Average Broker Recommendation | 1.33 (Strong Buy) |
Pulse Biosciences, Inc (PLSE) Company Bio
Pulse Biosciences, a development stage medical device company, focuses on developing medical technologies based on sub-microsecond pulsed electric field technology to detect and treat skin cancer and enhance wound healing. The company was founded in 2014 and is based in Burlingame, California.
Latest PLSE News From Around the Web
Below are the latest news stories about PULSE BIOSCIENCES INC that investors may wish to consider to help them evaluate PLSE as an investment opportunity.
11 Stocks with Heavy Insider Buying in 2023In this article, we will take a look at the 11 stocks with heavy insider buying in 2023. To see more such companies, go directly to 5 Stocks with Heavy Insider Buying in 2023. Insider trading activity has always invited interest and controversy from investors and authorities. Recent history has proven time and again that […] |
Pulse Biosciences’ Nanosecond Pulsed Field Ablation (nsPFA™) Technology to be Featured in Several Presentations at The Heart Rhythm 2023 Annual MeetingHAYWARD, Calif., May 18, 2023--Pulse Biosciences, Inc. (Nasdaq: PLSE), a company leveraging its novel and proprietary Nanosecond Pulsed Field Ablation (nsPFA) technology for the treatment of atrial fibrillation, today announced nsPFA will be featured in three presentations at the upcoming Heart Rhythm 2023 Annual Meeting in New Orleans, LA from May 19-21. |
Pulse Biosciences, Inc. (NASDAQ:PLSE) Q1 2023 Earnings Call TranscriptPulse Biosciences, Inc. (NASDAQ:PLSE) Q1 2023 Earnings Call Transcript May 11, 2023 Pulse Biosciences, Inc. misses on earnings expectations. Reported EPS is $-0.23 EPS, expectations were $-0.22. Operator: Good afternoon, ladies and gentlemen and thank you for standing by. Welcome to the Pulse Biosciences First Quarter 2023 Earnings Conference Call. At this time all participants […] |
Q1 2023 Pulse Biosciences Inc Earnings CallQ1 2023 Pulse Biosciences Inc Earnings Call |
Pulse Biosciences Reports Business Updates and First Quarter 2023 Financial ResultsHAYWARD, Calif., May 11, 2023--Pulse Biosciences, Inc. (Nasdaq: PLSE), a company leveraging its novel and proprietary nanosecond pulsed field ablation (nsPFA™) technology for the treatment of atrial fibrillation, today announced financial results for the first quarter ended March 31, 2023. |
PLSE Price Returns
1-mo | -8.96% |
3-mo | 127.11% |
6-mo | 193.84% |
1-year | 178.03% |
3-year | -31.79% |
5-year | -61.49% |
YTD | 123.83% |
2022 | -81.30% |
2021 | -37.93% |
2020 | 77.93% |
2019 | 17.02% |
2018 | -51.44% |
Loading social stream, please wait...