Plug Power, Inc. (PLUG): Price and Financial Metrics

Plug Power, Inc. (PLUG): $7.55

0.08 (+1.07%)

POWR Rating

Component Grades

Momentum

D

Stability

F

Sentiment

Quality

F

Add PLUG to Watchlist
Sign Up

Industry: Industrial - Equipment

Industry

B

Ranked

#91 of 92

in industry

PLUG Price/Volume Stats

Current price $7.55 52-week high $23.45
Prev. close $7.47 52-week low $7.27
Day low $7.27 Volume 16,027,568
Day high $7.68 Avg. volume 21,038,189
50-day MA $9.60 Dividend yield N/A
200-day MA $11.27 Market Cap 4.54B

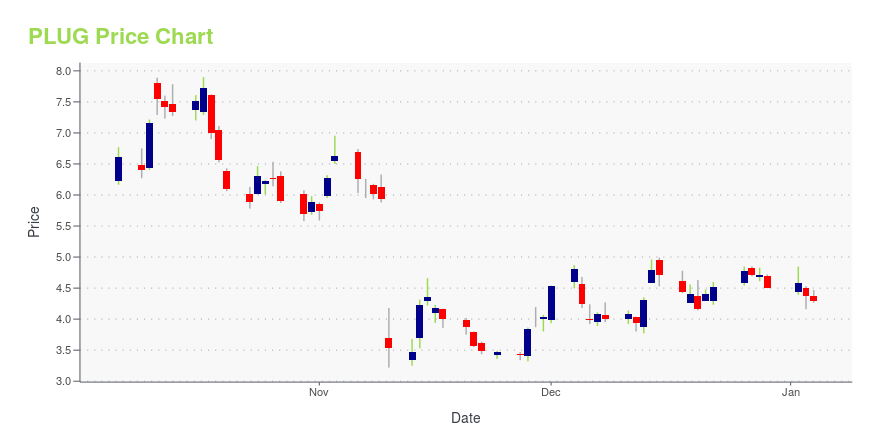
PLUG Stock Price Chart Interactive Chart >

PLUG POWR Grades

  • Growth is the dimension where PLUG ranks best; there it ranks ahead of 37.96% of US stocks.
  • The strongest trend for PLUG is in Stability, which has been heading down over the past 177 days.
  • PLUG ranks lowest in Quality; there it ranks in the 1st percentile.

PLUG Stock Summary

  • The capital turnover (annual revenue relative to shareholder's equity) for PLUG is 0.24 -- better than only 19.23% of US stocks.
  • Revenue growth over the past 12 months for PLUG POWER INC comes in at 47.16%, a number that bests 88.3% of the US stocks we're tracking.
  • In terms of volatility of its share price, PLUG is more volatile than 81.15% of stocks we're observing.
  • Stocks with similar financial metrics, market capitalization, and price volatility to PLUG POWER INC are YOU, LOCL, PATH, DDD, and VUZI.
  • PLUG's SEC filings can be seen here. And to visit PLUG POWER INC's official web site, go to www.plugpower.com.

PLUG Valuation Summary

  • PLUG's price/earnings ratio is -5.9; this is 131.72% lower than that of the median Industrials stock.
  • PLUG's price/earnings ratio has moved up 0.8 over the prior 243 months.

Below are key valuation metrics over time for PLUG.

Stock Date P/S P/B P/E EV/EBIT
PLUG 2023-09-19 5.6 1.3 -5.9 -5.5
PLUG 2023-09-18 5.6 1.3 -5.9 -5.4
PLUG 2023-09-15 5.8 1.4 -6.1 -5.7
PLUG 2023-09-14 6.0 1.4 -6.3 -5.9
PLUG 2023-09-13 5.6 1.3 -5.9 -5.5
PLUG 2023-09-12 5.7 1.3 -6.0 -5.5

PLUG Growth Metrics

    The year over year price growth rate now stands at -51.12%.
  • Its year over year cash and equivalents growth rate is now at -32.27%.
  • The 4 year net income to common stockholders growth rate now stands at -27.47%.
PLUG's revenue has moved up $412,365,000 over the prior 33 months.

The table below shows PLUG's growth in key financial areas (numbers in millions of US dollars).

Date Revenue Operating Cash Flow Net Income to Common Stock
2022-09-30 642.604 -531.724 -693.457
2022-06-30 597.898 -516.654 -629.37
2022-03-31 571.188 -450.996 -555.708
2021-12-31 502.342 -358.176 -459.965
2021-09-30 31.328 -347.067 -777.699
2021-06-30 -5.605 -290.864 -710.407

PLUG's Quality Factors

The “Quality” component of the POWR Ratings focuses on 31 different factors of a companies fundamentals and operational strength. Here are some key insights as we drill into the specifics of these quality attributes.
  • PLUG has a Quality Grade of F, ranking ahead of 3.21% of graded US stocks.
  • PLUG's asset turnover comes in at -0.001 -- ranking 53rd of 53 Electrical Equipment stocks.
  • EMR, CCF, and WWD are the stocks whose asset turnover ratios are most correlated with PLUG.

The table below shows PLUG's key quality metrics over time.

Period Asset Turnover Gross Margin ROIC
2021-06-30 -0.001 93.219 -0.448
2021-03-31 -0.024 7.684 -0.538
2020-12-31 -0.067 5.035 -0.605
2020-09-30 0.310 0.059 -0.075
2020-06-30 0.339 0.096 -0.065
2020-03-31 0.399 0.120 -0.071

PLUG Price Target

For more insight on analysts targets of PLUG, see our PLUG price target page. And for a list of of all stocks sorted by upside potential based on analyst target price, see our Top Price Target page.

Average Price Target $43.06 Average Broker Recommendation 1.52 (Moderate Buy)

Plug Power, Inc. (PLUG) Company Bio


Plug Power Inc provides alternative energy technology. It is engaged in the design, development, commercialization, and manufacture of hydrogen fuel cell systems used for the industrial off-road market and the stationary power market. Some of the company’s more recognizable customers include Amazon, BMW, The Southern Company, Carrefour, and WalMart. Plug Power has recently expanded its offerings to serve the zero-emission vehicle, robotics, and data center markets. The company is headquartered in Latham, New York and has offices in Washington D.C. and the Netherlands. Plug Power expanded it’s workforce in the last year for a current total of over 800 employees. The company’s Chief Executive Officer is Andrew J. Marsh.


PLUG Latest News Stream


Event/Time News Detail
Loading, please wait...

PLUG Latest Social Stream


Loading social stream, please wait...

View Full PLUG Social Stream

Latest PLUG News From Around the Web

Below are the latest news stories about PLUG POWER INC that investors may wish to consider to help them evaluate PLUG as an investment opportunity.

7 Strong Sell Stocks Ready to Take a Deep Dive

If you own any of these seven strong sell stocks, consider now the perfect time to take the money and run.

Thomas Niel on InvestorPlace | September 25, 2023

Plug Power, 2 Other Stocks Are Winners in U.S. Hydrogen, Says Analyst

HSBC analysts initiated coverage of hydrogen technology stocks Plug Power, Bloom Energy, and Chart industries at Buy.

Yahoo | September 25, 2023

Beware! 3 Hydrogen Stocks Waving Massive Red Flags Right Now.

Investors should consider unloading these hydrogen stocks to sell.

Tyrik Torres on InvestorPlace | September 21, 2023

Betting Big: 3 Hydrogen Stocks Primed for a Breakout.

Recent developments in the clean energy revolution have led to the rise of hydrogen stocks to buy now.

Matthew Farley on InvestorPlace | September 21, 2023

3 Hydrogen Stocks That Should Be on Every Investor’s Radar This Fall

With a projected 30% drop in costs by 2030 and a massive total addressable $1 trillion market, discover the best hydrogen stocks to buy.

Muslim Farooque on InvestorPlace | September 21, 2023

Read More 'PLUG' Stories Here

PLUG Price Returns

1-mo -7.13%
3-mo -20.02%
6-mo -32.89%
1-year -65.19%
3-year -35.19%
5-year 297.37%
YTD -38.97%
2022 -56.18%
2021 -16.75%
2020 973.10%
2019 154.84%
2018 -47.46%

Get Free Updates

Join thousands of investors who get the latest news, insights and top rated picks from StockNews.com!