ePlus inc. (PLUS): Price and Financial Metrics
PLUS Price/Volume Stats
Current price | $78.54 | 52-week high | $83.57 |
Prev. close | $77.99 | 52-week low | $41.71 |
Day low | $77.33 | Volume | 217,500 |
Day high | $78.60 | Avg. volume | 233,311 |
50-day MA | $78.07 | Dividend yield | N/A |
200-day MA | $67.85 | Market Cap | 2.12B |
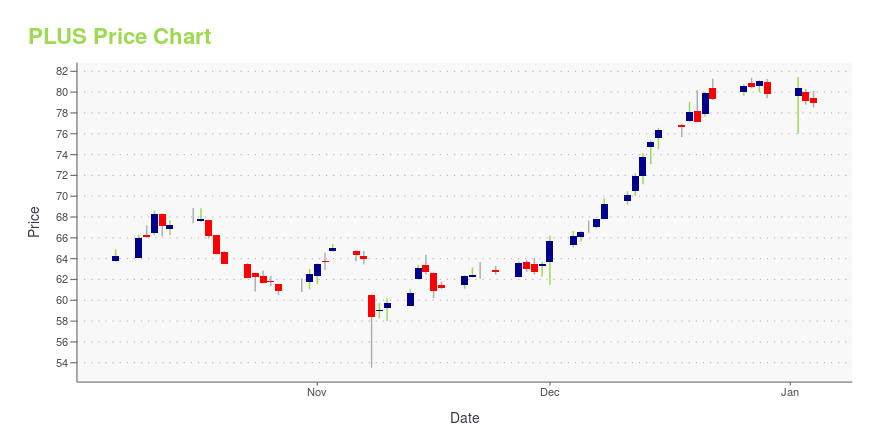
PLUS Stock Price Chart Interactive Chart >
PLUS POWR Grades
- Value is the dimension where PLUS ranks best; there it ranks ahead of 84.82% of US stocks.
- PLUS's strongest trending metric is Momentum; it's been moving up over the last 26 weeks.
- PLUS's current lowest rank is in the Momentum metric (where it is better than 31.21% of US stocks).
PLUS Stock Summary
- Of note is the ratio of EPLUS INC's sales and general administrative expense to its total operating expenses; 80.06% of US stocks have a lower such ratio.
- The ratio of debt to operating expenses for EPLUS INC is higher than it is for about just 4.2% of US stocks.
- With a year-over-year growth in debt of -97.87%, EPLUS INC's debt growth rate surpasses merely 0.79% of about US stocks.
- Stocks with similar financial metrics, market capitalization, and price volatility to EPLUS INC are EIG, RGP, MPTI, WEYS, and LSF.
- Visit PLUS's SEC page to see the company's official filings. To visit the company's web site, go to www.eplus.com.
PLUS Valuation Summary
- PLUS's price/sales ratio is 0.8; this is 70.37% lower than that of the median Technology stock.
- PLUS's price/sales ratio has moved up 0.4 over the prior 243 months.
Below are key valuation metrics over time for PLUS.
Stock | Date | P/S | P/B | P/E | EV/EBIT |
---|---|---|---|---|---|
PLUS | 2023-12-08 | 0.8 | 2.2 | 13.8 | 9.5 |
PLUS | 2023-12-07 | 0.8 | 2.2 | 13.5 | 9.3 |
PLUS | 2023-12-06 | 0.8 | 2.1 | 13.4 | 9.2 |
PLUS | 2023-12-05 | 0.8 | 2.1 | 13.3 | 9.1 |
PLUS | 2023-12-04 | 0.8 | 2.1 | 13.2 | 9.1 |
PLUS | 2023-12-01 | 0.8 | 2.1 | 13.1 | 9.0 |
PLUS Growth Metrics
- Its year over year price growth rate is now at 23.28%.
- Its year over year net income to common stockholders growth rate is now at 41.94%.
- Its 3 year net income to common stockholders growth rate is now at 67.11%.
The table below shows PLUS's growth in key financial areas (numbers in millions of US dollars).
Date | Revenue | Operating Cash Flow | Net Income to Common Stock |
---|---|---|---|
2022-12-31 | 2,027.06 | -46.067 | 110.747 |
2022-09-30 | 1,898.418 | -5.238 | 101.477 |
2022-06-30 | 1,862.729 | -58.378 | 104.421 |
2022-03-31 | 1,821.019 | -20.571 | 105.6 |
2021-12-31 | 1,722.107 | 2.721 | 96.908 |
2021-09-30 | 1,654.877 | -13.905 | 92.122 |
PLUS's Quality Factors
The “Quality” component of the POWR Ratings focuses on 31 different factors of a companies fundamentals and operational strength. Here are some key insights as we drill into the specifics of these quality attributes.- PLUS has a Quality Grade of D, ranking ahead of 22.43% of graded US stocks.
- PLUS's asset turnover comes in at 1.51 -- ranking 50th of 105 Wholesale stocks.
- PDCO, TESS, and WEYS are the stocks whose asset turnover ratios are most correlated with PLUS.
The table below shows PLUS's key quality metrics over time.
Period | Asset Turnover | Gross Margin | ROIC |
---|---|---|---|
2021-06-30 | 1.510 | 0.246 | 0.350 |
2021-03-31 | 1.459 | 0.251 | 0.358 |
2020-12-31 | 1.531 | 0.245 | 0.345 |
2020-09-30 | 1.600 | 0.248 | 0.348 |
2020-06-30 | 1.629 | 0.254 | 0.341 |
2020-03-31 | 1.740 | 0.246 | 0.333 |
PLUS Price Target
For more insight on analysts targets of PLUS, see our PLUS price target page. And for a list of of all stocks sorted by upside potential based on analyst target price, see our Top Price Target page.
Average Price Target | $110.50 | Average Broker Recommendation | 1.33 (Strong Buy) |
ePlus inc. (PLUS) Company Bio
ePlus Inc. designs, implements and provides provide leading information technology products and services, flexible leasing and financing solutions, and enterprise supply management to enable its customers to optimize their IT infrastructure and supply chain processes. The company was founded in 1990 and is based in Herndon, Virginia.
Latest PLUS News From Around the Web
Below are the latest news stories about EPLUS INC that investors may wish to consider to help them evaluate PLUS as an investment opportunity.
ePlus' (NASDAQ:PLUS) five-year earnings growth trails the 18% YoY shareholder returnsThe most you can lose on any stock (assuming you don't use leverage) is 100% of your money. But when you pick a company... |
ePlus Achieves the AWS Resilience CompetencyePlus inc. (NASDAQ NGS: PLUS – news) today announced that it has achieved the Amazon Web Services (AWS) Resilience Competency in the Resilience Recovery category. This specialization recognizes ePlus as an AWS Partner using AWS Resilience Services to provide validated solutions to help customers improve their critical systems availability and resilience posture. As each customer and their critical workloads have unique availability requirements, AWS Resilience Competency Partners provide tailore |
Estimating The Intrinsic Value Of ePlus inc. (NASDAQ:PLUS)Key Insights Using the 2 Stage Free Cash Flow to Equity, ePlus fair value estimate is US$59.80 Current share price of... |
Cisco Awards ePlus the Global Customer Experience (CX) Partner of the Year at Cisco Partner SummitePlus inc. (NASDAQ NGS: PLUS – news) today announced it has been named the Global Customer Experience (CX) Partner of the Year at Cisco Partner Summit 2023. Cisco's Partner Summit Global Awards recognize top-performing partners across 21 categories demonstrating innovation in delivering solutions that help customers succeed in new ways. |
ePlus inc. (NASDAQ:PLUS) Q2 2024 Earnings Call TranscriptePlus inc. (NASDAQ:PLUS) Q2 2024 Earnings Call Transcript November 7, 2023 ePlus inc. misses on earnings expectations. Reported EPS is $1.22 EPS, expectations were $1.34. Operator: Good day, ladies and gentlemen. Welcome to the ePlus Earnings Results Conference Call. As a reminder, this conference call is being recorded. I would now like to introduce your […] |
PLUS Price Returns
1-mo | -3.31% |
3-mo | -1.63% |
6-mo | 23.65% |
1-year | 63.97% |
3-year | 57.84% |
5-year | 77.41% |
YTD | -1.63% |
2023 | 80.31% |
2022 | -17.82% |
2021 | 22.52% |
2020 | 4.34% |
2019 | 18.43% |
Continue Researching PLUS
Want to see what other sources are saying about Eplus Inc's financials and stock price? Try the links below:Eplus Inc (PLUS) Stock Price | Nasdaq
Eplus Inc (PLUS) Stock Quote, History and News - Yahoo Finance
Eplus Inc (PLUS) Stock Price and Basic Information | MarketWatch
Loading social stream, please wait...