
Plexus Corp. (PLXS): Price and Financial Metrics
PLXS Price/Volume Stats
| Current price | $129.85 | 52-week high | $132.46 |
| Prev. close | $129.59 | 52-week low | $87.21 |
| Day low | $128.33 | Volume | 152,848 |
| Day high | $132.08 | Avg. volume | 126,259 |
| 50-day MA | $108.86 | Dividend yield | N/A |
| 200-day MA | $101.31 | Market Cap | 3.56B |
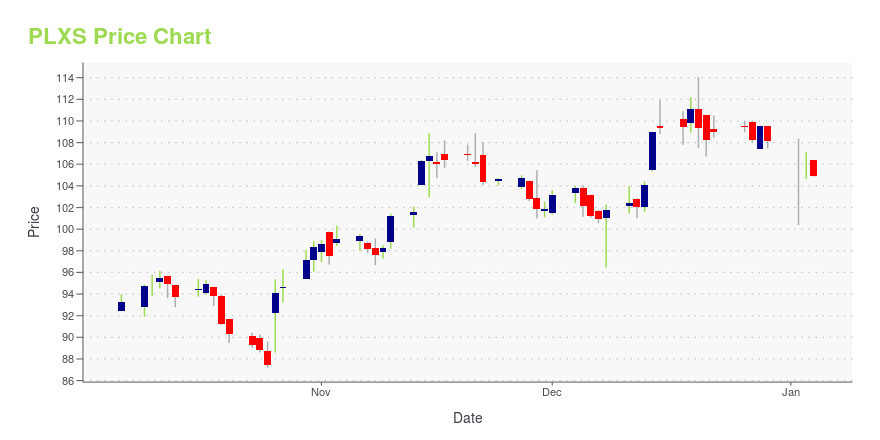
PLXS Stock Price Chart Interactive Chart >
Plexus Corp. (PLXS) Company Bio
Plexus Corporation provides product design,supply chain and materials management, manufacturing, test, fulfillment and aftermarket solutions to branded product companies in the Wireline/Networking, Wireless Infrastructure,Medical, Industrial/Commercial and Defense/Security/Aerospace market sectors. The company was founded in 1979 and is based in Neenah, Wisconsin.
Latest PLXS News From Around the Web
Below are the latest news stories about PLEXUS CORP that investors may wish to consider to help them evaluate PLXS as an investment opportunity.
Plexus Provides Update on Unverified List RemovalNEENAH, WI, Dec. 27, 2023 (GLOBE NEWSWIRE) -- Plexus Corp. (NASDAQ: PLXS) today received notification through official written correspondence from the U.S. Department of Commerce that its China subsidiary (“Plexus Xiamen”) will be removed from the Bureau of Industry and Security’s (“BIS”) Unverified List. Through no fault of Plexus or the BIS, a delay in the routine verification of a shipment to Plexus Xiamen occurred, which as a result of strong cooperation between the organizations has now bee |
Is Plexus Corp.'s (NASDAQ:PLXS) Latest Stock Performance A Reflection Of Its Financial Health?Plexus' (NASDAQ:PLXS) stock is up by a considerable 20% over the past three months. Since the market usually pay for a... |
Plexus Provides Update on Unverified List DesignationNEENAH, WI, Dec. 20, 2023 (GLOBE NEWSWIRE) -- On December 19, 2023, Plexus Corp. (NASDAQ: PLXS) learned that the U.S Department of Commerce placed its Xiamen, China subsidiary (“Plexus Xiamen”) on the Bureau of Industry and Security’s (“BIS”) Unverified List. Companies appearing on the Unverified List are not barred from conducting business with the United States and their U.S. customers and suppliers. Plexus maintains a robust export compliance program across all of its international operations |
Plexus Joins the United Nations Global CompactNEENAH, WI, Dec. 15, 2023 (GLOBE NEWSWIRE) -- Plexus Corp. (NASDAQ: PLXS) announced today that it has joined the United Nations (UN) Global Compact, a voluntary leadership platform for the development, implementation and disclosure of socially responsible business practices. The UN Global Compact is a call to companies to align operations and strategies with ten universally accepted principles in the areas of human rights, labor, environment and anti-corruption, and to take action in support of |
Sidoti Events, LLC's Virtual December Small-Cap ConferenceNEW YORK, NY / ACCESSWIRE / December 5, 2023 / Sidoti Events, LLC, an affiliate of Sidoti & Company, LLC, has released the presentation schedule and weblinks for its two-day December Small-Cap Conference taking place Wednesday and Thursday, December ... |
PLXS Price Returns
| 1-mo | 27.34% |
| 3-mo | 29.49% |
| 6-mo | 39.58% |
| 1-year | 31.77% |
| 3-year | 51.08% |
| 5-year | 120.91% |
| YTD | 20.09% |
| 2023 | 5.05% |
| 2022 | 7.34% |
| 2021 | 22.61% |
| 2020 | 1.65% |
| 2019 | 50.63% |
Continue Researching PLXS
Want to see what other sources are saying about Plexus Corp's financials and stock price? Try the links below:Plexus Corp (PLXS) Stock Price | Nasdaq
Plexus Corp (PLXS) Stock Quote, History and News - Yahoo Finance
Plexus Corp (PLXS) Stock Price and Basic Information | MarketWatch
Loading social stream, please wait...