
Plymouth Industrial REIT, Inc. (PLYM): Price and Financial Metrics
PLYM Price/Volume Stats
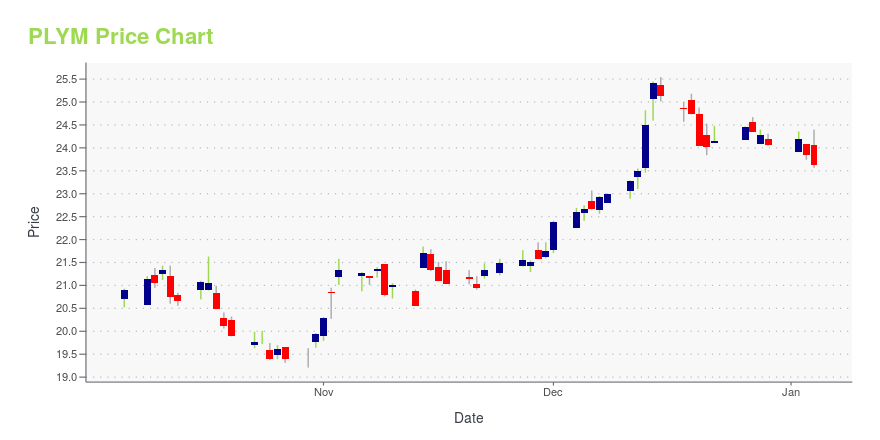
| Current price | $24.22 | 52-week high | $25.55 |
| Prev. close | $23.76 | 52-week low | $19.21 |
| Day low | $24.00 | Volume | 233,054 |
| Day high | $24.34 | Avg. volume | 231,178 |
| 50-day MA | $21.69 | Dividend yield | 3.92% |
| 200-day MA | $21.80 | Market Cap | 1.10B |
PLYM Stock Price Chart Interactive Chart >
Plymouth Industrial REIT, Inc. (PLYM) Company Bio
Plymouth Industrial REIT, Inc. is a privately owned investment manager. The firm invests in the real estate markets across across the Eastern half of the United States and Texas. It is focused on the acquisition, ownership and management of single-and multi-tenant Class B industrial properties, including distribution centers, warehouses and light industrial properties. It was formerly known as Plymouth Opportunity REIT, Inc. The company was founded in 2011 and is based in Boston, Massachusetts.
Latest PLYM News From Around the Web
Below are the latest news stories about PLYMOUTH INDUSTRIAL REIT INC that investors may wish to consider to help them evaluate PLYM as an investment opportunity.
Plymouth Industrial REIT Reports Third Quarter ResultsBOSTON, Nov. 02, 2023 (GLOBE NEWSWIRE) -- Plymouth Industrial REIT, Inc. (NYSE: PLYM) (the “Company”) today announced its financial results for the third quarter ended September 30, 2023 and other recent developments. Third Quarter and Subsequent Highlights Reported results for the third quarter of 2023 reflect net income attributable to common stockholders of $0.17 per weighted average common share; Core Funds from Operations attributable to common stockholders and unit holders (“Core FFO”) of |
Why These 3 REITs Are Too Risky to HoldWith most REITs wading through choppy waters right now, savvy investors know its time to jump ship on these three before they sink. |
Plymouth Industrial REIT Provides Activity Update for Third Quarter 2023Announces Details for Third Quarter Earnings Conference CallBOSTON, Oct. 05, 2023 (GLOBE NEWSWIRE) -- Plymouth Industrial REIT, Inc. (NYSE: PLYM) announced its leasing and development activity for the third quarter of 2023. The Company also announced details for its third quarter earnings conference call and webcast to be held on November 2, 2023. Jeff Witherell, Chief Executive Officer and Co-Founder of Plymouth, noted, “The fundamentals within our markets provide a continued tailwind to our st |
Plymouth (PLYM) Sells Asset to Up Flexibility & Fund DevelopmentPlymouth's (PLYM) recent sale of a Chicago industrial building is a strategic step toward optimizing its portfolio. |
Bedford Park industrial building sells to user for nearly $20 millionThe nearly 307,000-square-foot property was sold to its owner-user. The building was leased to DesignPac in the second quarter of 2022. |
PLYM Price Returns
| 1-mo | 17.27% |
| 3-mo | 18.01% |
| 6-mo | 9.55% |
| 1-year | 10.51% |
| 3-year | 23.10% |
| 5-year | 69.35% |
| YTD | 2.91% |
| 2023 | 30.76% |
| 2022 | -37.29% |
| 2021 | 121.67% |
| 2020 | -11.82% |
| 2019 | 58.65% |
PLYM Dividends
| Ex-Dividend Date | Type | Payout Amount | Change | ||||||
|---|---|---|---|---|---|---|---|---|---|
| Loading, please wait... | |||||||||
Continue Researching PLYM
Here are a few links from around the web to help you further your research on Plymouth Industrial REIT Inc's stock as an investment opportunity:Plymouth Industrial REIT Inc (PLYM) Stock Price | Nasdaq
Plymouth Industrial REIT Inc (PLYM) Stock Quote, History and News - Yahoo Finance
Plymouth Industrial REIT Inc (PLYM) Stock Price and Basic Information | MarketWatch
Loading social stream, please wait...