
Philip Morris International Inc. (PM): Price and Financial Metrics
PM Price/Volume Stats
| Current price | $113.36 | 52-week high | $113.68 |
| Prev. close | $113.20 | 52-week low | $87.23 |
| Day low | $112.56 | Volume | 5,381,711 |
| Day high | $113.50 | Avg. volume | 5,380,315 |
| 50-day MA | $103.23 | Dividend yield | 4.75% |
| 200-day MA | $95.26 | Market Cap | 176.22B |
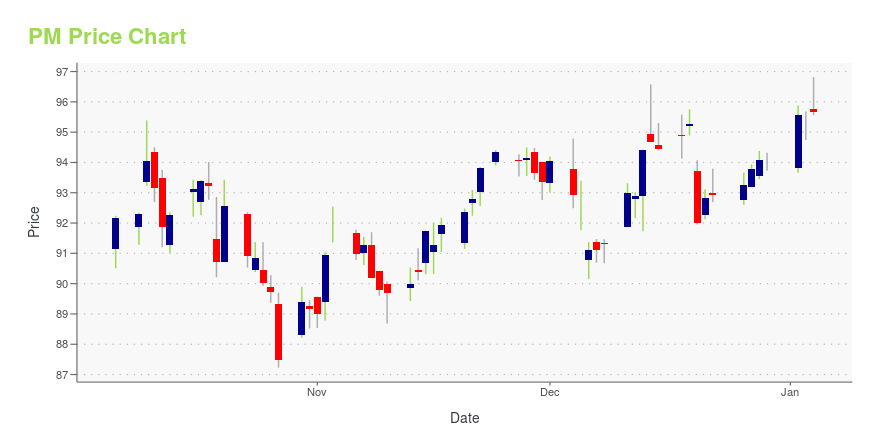
PM Stock Price Chart Interactive Chart >
Philip Morris International Inc. (PM) Company Bio
Philip Morris International Inc. (PMI) is a Swiss-American multinational cigarette and tobacco manufacturing company, with products sold in over 180 countries. The most recognized and best selling product of the company is Marlboro. Philip Morris International is often referred to as one of the companies comprising Big Tobacco. (Source:Wikipedia)
Latest PM News From Around the Web
Below are the latest news stories about PHILIP MORRIS INTERNATIONAL INC that investors may wish to consider to help them evaluate PM as an investment opportunity.
The 3 Hottest Dividend Stocks to Watch in 2024You know what I hate about the typical article about hottest dividend stocks to watch? |
Kaival Brands Appoints Executive Chairman Barry Hopkins as Interim Chief Executive Officer and PresidentFormer Altria and Turning Point Brands Senior Executive Brings Decades of Experience and Relationships to Kaival BrandsGRANT-VALKARIA, Fla., Dec. 28, 2023 (GLOBE NEWSWIRE) -- Kaival Brands Innovations Group, Inc. (NASDAQ: KAVL) ("Kaival Brands," the "Company," or "we") today announced that it has expanded the role of Barry M. Hopkins, Executive Chairman, to include the positions of Interim Chief Executive Officer & President. Former Chief Executive Officer & President, Eric Mosser, has been appo |
How to Boost Your Portfolio with Top Consumer Staples Stocks Set to Beat EarningsInvestors looking for ways to find stocks that are set to beat quarterly earnings estimates should check out the Zacks Earnings ESP. |
14 Cheap DRIP Stocks To Buy NowIn this article, we discuss 14 cheap DRIP stocks to buy now. You can skip our detailed analysis of dividend reinvestment plans and performance of dividend stocks in the past, and go directly to read 5 Cheap DRIP Stocks To Buy Now. Investing in dividend stocks is often seen as a game for patient investors […] |
Philip Morris International (NYSE:PM) Is Reinvesting At Lower Rates Of ReturnWhat trends should we look for it we want to identify stocks that can multiply in value over the long term? One common... |
PM Price Returns
| 1-mo | 11.18% |
| 3-mo | 20.85% |
| 6-mo | 28.15% |
| 1-year | 21.42% |
| 3-year | 33.19% |
| 5-year | 74.23% |
| YTD | 23.76% |
| 2023 | -1.85% |
| 2022 | 12.31% |
| 2021 | 20.78% |
| 2020 | 3.69% |
| 2019 | 35.02% |
PM Dividends
| Ex-Dividend Date | Type | Payout Amount | Change | ||||||
|---|---|---|---|---|---|---|---|---|---|
| Loading, please wait... | |||||||||
Continue Researching PM
Want to see what other sources are saying about Philip Morris International Inc's financials and stock price? Try the links below:Philip Morris International Inc (PM) Stock Price | Nasdaq
Philip Morris International Inc (PM) Stock Quote, History and News - Yahoo Finance
Philip Morris International Inc (PM) Stock Price and Basic Information | MarketWatch
Loading social stream, please wait...