
PNC Financial Services Group Inc. (PNC): Price and Financial Metrics
PNC Price/Volume Stats
| Current price | $181.21 | 52-week high | $182.51 |
| Prev. close | $180.00 | 52-week low | $109.40 |
| Day low | $180.05 | Volume | 1,824,118 |
| Day high | $182.42 | Avg. volume | 1,928,252 |
| 50-day MA | $160.23 | Dividend yield | 3.58% |
| 200-day MA | $148.08 | Market Cap | 72.10B |
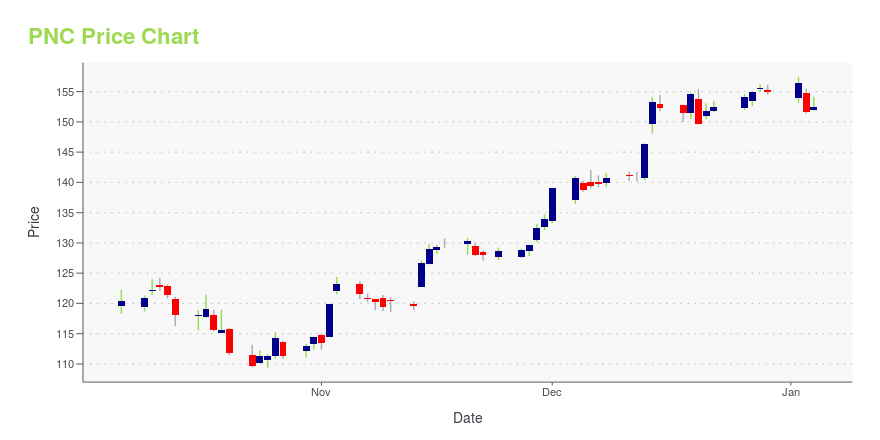
PNC Stock Price Chart Interactive Chart >
PNC Financial Services Group Inc. (PNC) Company Bio
PNC Financial Services Group, Inc. (stylized as PNC) is a bank holding company and financial services corporation based in Pittsburgh, Pennsylvania. Its banking subsidiary, PNC Bank, operates in 21 states and the District of Columbia with 2,296 branches and 9,051 ATMs. The company also provides financial services such as asset management, wealth management, estate planning, loan servicing, and information processing. (Source:Wikipedia)
Latest PNC News From Around the Web
Below are the latest news stories about PNC FINANCIAL SERVICES GROUP INC that investors may wish to consider to help them evaluate PNC as an investment opportunity.
Dividend Contenders List Ranked By Yield: Top 25In this article, we discuss top 25 dividend contenders according to yields. You can skip our detailed analysis of dividend stocks and their previous performance, and go directly to read Dividend Contenders List Ranked By Yield: Top 10. Dividend contenders typically refer to companies that have consistently increased their dividends for at least 10 consecutive […] |
The PNC Financial Services Group, Inc (PNC) Beats Stock Market Upswing: What Investors Need to KnowIn the most recent trading session, The PNC Financial Services Group, Inc (PNC) closed at $151.77, indicating a +1.4% shift from the previous trading day. |
The PNC Financial Services Group, Inc (PNC) Stock Drops Despite Market Gains: Important Facts to NoteIn the latest trading session, The PNC Financial Services Group, Inc (PNC) closed at $151.41, marking a -0.6% move from the previous day. |
14 Best Bank Dividend Stocks To Buy NowIn this article, we discuss 14 best bank dividend stocks to buy now. You can skip our detailed analysis of the banking sector and the performance of bank stocks, and go directly to read 5 Best Bank Dividend Stocks To Buy Now. During most of the 2022 market decline, financial stocks were seen as a […] |
11 Most Profitable Bank Stocks To Invest InIn this piece, we will take a look at the 11 most profitable bank stocks to invest in. If you want to skip out on our introduction to the banking industry and the stock market, then head on over to 5 Most Profitable Bank Stocks To Invest In. The banking industry has been at the […] |
PNC Price Returns
| 1-mo | 20.51% |
| 3-mo | 17.19% |
| 6-mo | 21.90% |
| 1-year | 42.12% |
| 3-year | 10.39% |
| 5-year | 52.64% |
| YTD | 20.57% |
| 2023 | 2.71% |
| 2022 | -18.59% |
| 2021 | 38.18% |
| 2020 | -2.78% |
| 2019 | 40.91% |
PNC Dividends
| Ex-Dividend Date | Type | Payout Amount | Change | ||||||
|---|---|---|---|---|---|---|---|---|---|
| Loading, please wait... | |||||||||
Continue Researching PNC
Here are a few links from around the web to help you further your research on Pnc Financial Services Group Inc's stock as an investment opportunity:Pnc Financial Services Group Inc (PNC) Stock Price | Nasdaq
Pnc Financial Services Group Inc (PNC) Stock Quote, History and News - Yahoo Finance
Pnc Financial Services Group Inc (PNC) Stock Price and Basic Information | MarketWatch
Loading social stream, please wait...