
PennantPark Investment Corporation - common stock (PNNT): Price and Financial Metrics
PNNT Price/Volume Stats
| Current price | $7.25 | 52-week high | $8.04 |
| Prev. close | $7.28 | 52-week low | $6.01 |
| Day low | $7.20 | Volume | 402,700 |
| Day high | $7.31 | Avg. volume | 449,514 |
| 50-day MA | $7.49 | Dividend yield | 13.24% |
| 200-day MA | $6.94 | Market Cap | 472.88M |
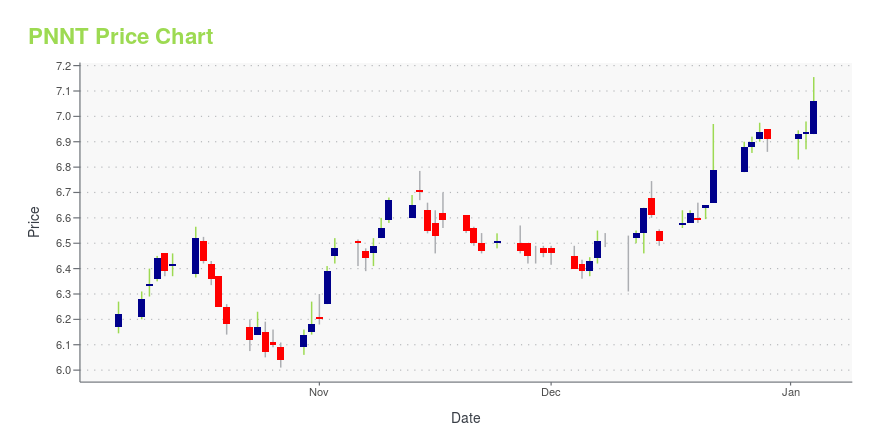
PNNT Stock Price Chart Interactive Chart >
PennantPark Investment Corporation - common stock (PNNT) Company Bio
PennantPark Investment Corporation is a publicly listed business development firm specializing in direct and mezzanine investments in middle market companies. It invests in the form of mezzanine debt, senior secured loans, and equity investments. The company was founded on January 11, 2007 and is based in New York, New York.
Latest PNNT News From Around the Web
Below are the latest news stories about PENNANTPARK INVESTMENT CORP that investors may wish to consider to help them evaluate PNNT as an investment opportunity.
Is PennantPark Investment (PNNT) Stock Undervalued Right Now?Here at Zacks, our focus is on the proven Zacks Rank system, which emphasizes earnings estimates and estimate revisions to find great stocks. Nevertheless, we are always paying attention to the latest value, growth, and momentum trends to underscore strong picks. |
PennantPark Investment Corporation Announces Monthly Distribution of $0.07 per ShareMIAMI, Dec. 04, 2023 (GLOBE NEWSWIRE) -- PennantPark Investment Corporation (the "Company") (NYSE: PNNT) declares its monthly distribution for December 2023 of $0.07 per share, payable on January 2, 2024 to stockholders of record as of December 18, 2023. The distribution is expected to be paid from taxable net investment income. The final specific tax characteristics of the distribution will be reported to stockholders on Form 1099 after the end of the calendar year and in the Company's periodic |
PennantPark Investment Corporation Announces Financial Results for the Fourth Quarter and Fiscal Year Ended September 30, 2023MIAMI, Nov. 15, 2023 (GLOBE NEWSWIRE) -- PennantPark Investment Corporation (NYSE: PNNT) announced today financial results for the fourth quarter and fiscal year ended September 30, 2023. HIGHLIGHTS Year ended September 30, 2023 - Unaudited ($ in millions, except per share amounts) Assets and Liabilities: Investment portfolio(1) $1,001.9 Net assets $502.2 Adjusted net asset value per share(2) $7.70 Quarterly increase in adjusted net asset value per share(2) 0.4%GAAP net asset value per share $7. |
PennantPark Investment Corporation Schedules Earnings Release of Fourth Fiscal Quarter 2023 ResultsMIAMI, Oct. 13, 2023 (GLOBE NEWSWIRE) -- PennantPark Investment Corporation (the "Company") (NYSE: PNNT) announced that it will report results for the fourth fiscal quarter ended September 30, 2023 on Wednesday, November 15, 2023 after the close of the financial markets. The Company will also host a conference call at 12:00 p.m. (Eastern Time) on Thursday, November 16, 2023 to discuss its financial results. All interested parties are welcome to participate. You can access the conference call by |
PennantPark (PNNT) Moves to Strong Buy: Rationale Behind the UpgradePennantPark (PNNT) has been upgraded to a Zacks Rank #1 (Strong Buy), reflecting growing optimism about the company's earnings prospects. This might drive the stock higher in the near term. |
PNNT Price Returns
| 1-mo | -1.68% |
| 3-mo | 4.83% |
| 6-mo | 6.94% |
| 1-year | 28.72% |
| 3-year | 57.47% |
| 5-year | 93.03% |
| YTD | 12.70% |
| 2023 | 37.25% |
| 2022 | -8.90% |
| 2021 | 61.71% |
| 2020 | -18.00% |
| 2019 | 14.30% |
PNNT Dividends
| Ex-Dividend Date | Type | Payout Amount | Change | ||||||
|---|---|---|---|---|---|---|---|---|---|
| Loading, please wait... | |||||||||
Continue Researching PNNT
Here are a few links from around the web to help you further your research on Pennantpark Investment Corp's stock as an investment opportunity:Pennantpark Investment Corp (PNNT) Stock Price | Nasdaq
Pennantpark Investment Corp (PNNT) Stock Quote, History and News - Yahoo Finance
Pennantpark Investment Corp (PNNT) Stock Price and Basic Information | MarketWatch
Loading social stream, please wait...