Insulet Corp. (PODD): Price and Financial Metrics
PODD Price/Volume Stats
Current price | $285.56 | 52-week high | $335.91 |
Prev. close | $284.07 | 52-week low | $192.33 |
Day low | $281.14 | Volume | 543,700 |
Day high | $285.80 | Avg. volume | 725,717 |
50-day MA | $310.43 | Dividend yield | N/A |
200-day MA | $286.74 | Market Cap | 19.90B |
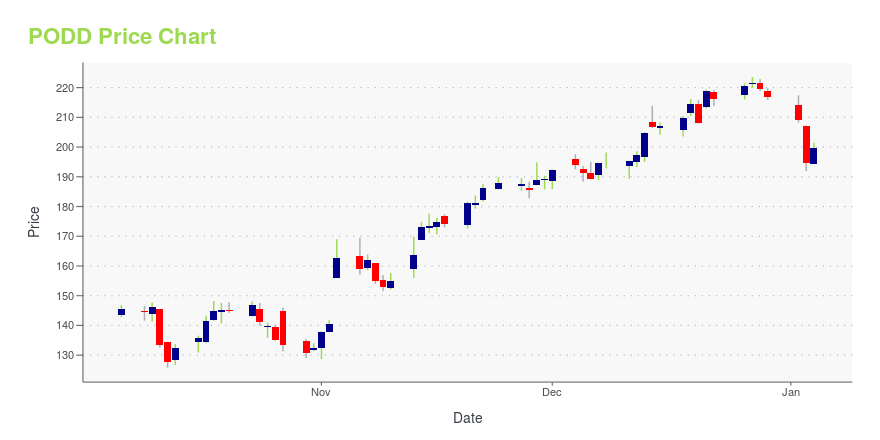
PODD Stock Price Chart Interactive Chart >
PODD POWR Grades
- PODD scores best on the Growth dimension, with a Growth rank ahead of 86.08% of US stocks.
- PODD's strongest trending metric is Quality; it's been moving down over the last 179 days.
- PODD's current lowest rank is in the Momentum metric (where it is better than 6.83% of US stocks).
PODD Stock Summary
- PODD's current price/earnings ratio is 34,121.92, which is higher than 100% of US stocks with positive earnings.
- Price to trailing twelve month operating cash flow for PODD is currently 153.7, higher than 97.81% of US stocks with positive operating cash flow.
- With a price/sales ratio of 14.97, INSULET CORP has a higher such ratio than 92.76% of stocks in our set.
- Stocks with similar financial metrics, market capitalization, and price volatility to INSULET CORP are INDT, CATO, LEV, RMNI, and OWL.
- Visit PODD's SEC page to see the company's official filings. To visit the company's web site, go to www.insulet.com.
PODD Valuation Summary
- PODD's EV/EBIT ratio is 830.8; this is 6823.33% higher than that of the median Healthcare stock.
- PODD's price/earnings ratio has moved up 34444.1 over the prior 195 months.
Below are key valuation metrics over time for PODD.
Stock | Date | P/S | P/B | P/E | EV/EBIT |
---|---|---|---|---|---|
PODD | 2023-05-23 | 15.1 | 41.1 | 34433.2 | 830.8 |
PODD | 2023-05-22 | 15.6 | 42.5 | 35608.8 | 858.2 |
PODD | 2023-05-19 | 15.3 | 41.7 | 34967.5 | 843.3 |
PODD | 2023-05-18 | 15.4 | 42.0 | 35181.3 | 848.2 |
PODD | 2023-05-17 | 16.0 | 43.4 | 36376.5 | 876.0 |
PODD | 2023-05-16 | 16.3 | 44.3 | 37156.0 | 894.2 |
PODD Growth Metrics
- The year over year net cashflow from operations growth rate now stands at -188.95%.
- Its 5 year revenue growth rate is now at 100.43%.
- Its 2 year net cashflow from operations growth rate is now at -152.81%.

The table below shows PODD's growth in key financial areas (numbers in millions of US dollars).
Date | Revenue | Operating Cash Flow | Net Income to Common Stock |
---|---|---|---|
2022-12-31 | 1,305.3 | 119 | 4.6 |
2022-09-30 | 1,243.3 | 42.8 | 16.8 |
2022-06-30 | 1,178.1 | -39.7 | 34.6 |
2022-03-31 | 1,141.9 | -46.7 | 44.6 |
2021-12-31 | 1,098.8 | -68.1 | 16.8 |
2021-09-30 | 1,037.2 | -43.6 | -29.5 |
PODD's Quality Factors
The “Quality” component of the POWR Ratings focuses on 31 different factors of a companies fundamentals and operational strength. Here are some key insights as we drill into the specifics of these quality attributes.- PODD has a Quality Grade of C, ranking ahead of 61.86% of graded US stocks.
- PODD's asset turnover comes in at 0.542 -- ranking 84th of 186 Medical Equipment stocks.
- UFPT, NEPH, and NSPR are the stocks whose asset turnover ratios are most correlated with PODD.
The table below shows PODD's key quality metrics over time.
Period | Asset Turnover | Gross Margin | ROIC |
---|---|---|---|
2021-06-30 | 0.542 | 0.666 | 0.011 |
2021-03-31 | 0.544 | 0.650 | 0.036 |
2020-12-31 | 0.573 | 0.644 | 0.034 |
2020-09-30 | 0.621 | 0.640 | 0.049 |
2020-06-30 | 0.642 | 0.638 | 0.040 |
2020-03-31 | 0.691 | 0.644 | 0.029 |
PODD Price Target
For more insight on analysts targets of PODD, see our PODD price target page. And for a list of of all stocks sorted by upside potential based on analyst target price, see our Top Price Target page.
Average Price Target | $290.41 | Average Broker Recommendation | 1.6 (Moderate Buy) |
Insulet Corp. (PODD) Company Bio
A medical device company developing and marketing insulin infusion system. (Source:Wiki)
Latest PODD News From Around the Web
Below are the latest news stories about INSULET CORP that investors may wish to consider to help them evaluate PODD as an investment opportunity.
Insiders Pour Millions Into These 2 Beaten-Down Stocks, Analysts Say They Could Be Ready to Bounce Back — Here’s Why You Should Pay AttentionSavvy investors will always be looking to pick up shares of undervalued stocks. That is, after all, the essence behind the slogan ‘buy low, sell high.’ The problem, though, lies in determining which stocks are merely temporarily languishing in the doldrums and are primed to pick up steam, rather than indicating that their depressed prices are just not worth the time of day. Of course, there are many ways to assess that scenario, and one simple strategy is to examine the actions taken by insiders |
Here's Why You Should Retain Insulet (PODD) Stock for NowInvestors continue to be optimistic about Insulet (PODD) on the robust performance of Omnipod 5. |
HAE or PODD: Which Is the Better Value Stock Right Now?HAE vs. PODD: Which Stock Is the Better Value Option? |
Insulet (NASDAQ:PODD) shareholder returns have been splendid, earning 271% in 5 yearsWhen you buy a stock there is always a possibility that it could drop 100%. But when you pick a company that is really... |
The Petri Dish: Laronde CEO exits after 6 months; Enanta seeks Covid pill partnerFinch Therapeutics forges a path forward, Insulet shakes up its C-suite, plus other biotech news in the Petri Dish. |
PODD Price Returns
1-mo | -13.14% |
3-mo | -0.21% |
6-mo | -5.86% |
1-year | 34.69% |
3-year | 59.50% |
5-year | 203.72% |
YTD | -3.00% |
2022 | 10.64% |
2021 | 4.08% |
2020 | 49.32% |
2019 | 115.83% |
2018 | 14.96% |
Continue Researching PODD
Here are a few links from around the web to help you further your research on Insulet Corp's stock as an investment opportunity:Insulet Corp (PODD) Stock Price | Nasdaq
Insulet Corp (PODD) Stock Quote, History and News - Yahoo Finance
Insulet Corp (PODD) Stock Price and Basic Information | MarketWatch
Loading social stream, please wait...