
Post Holdings, Inc. (POST): Price and Financial Metrics
POST Price/Volume Stats
| Current price | $108.97 | 52-week high | $110.88 |
| Prev. close | $107.94 | 52-week low | $78.85 |
| Day low | $108.40 | Volume | 517,200 |
| Day high | $109.48 | Avg. volume | 548,534 |
| 50-day MA | $105.24 | Dividend yield | N/A |
| 200-day MA | $97.74 | Market Cap | 6.60B |
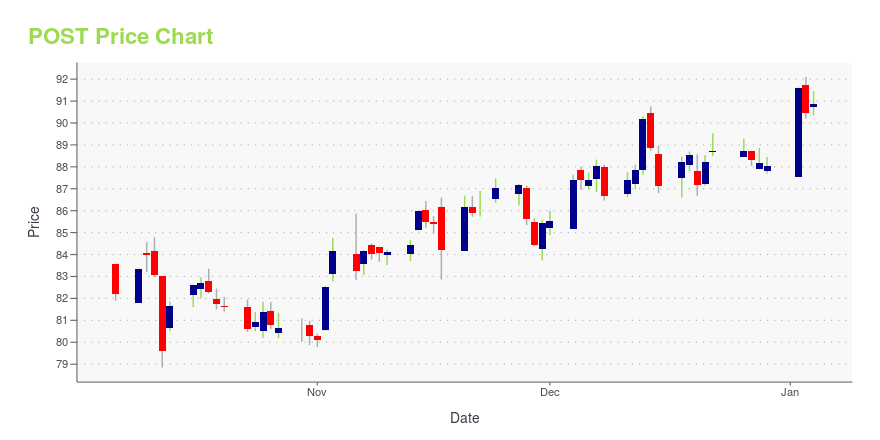
POST Stock Price Chart Interactive Chart >
Post Holdings, Inc. (POST) Company Bio
Post Holdings manufactures, markets, and sells refrigerated, active nutrition, and private label food products in the United States and Canada. The company operates through five segments: Post Foods, Michael Foods, Active Nutrition, Private Brands, and Attune Foods. The company was founded in 1895 and is based in St. Louis, Missouri.
Latest POST News From Around the Web
Below are the latest news stories about POST HOLDINGS INC that investors may wish to consider to help them evaluate POST as an investment opportunity.
Consumer Staples Sector Outlook: 3 Major Shifts Anticipated in 2024The consumer staples trends in 2024 suggest that business could be much better in 2024 due to higher volumes and elevated prices. |
Post Holdings Issues 2023 Environmental, Social and Governance ReportST. LOUIS, Dec. 14, 2023 (GLOBE NEWSWIRE) -- Post Holdings, Inc. (NYSE:POST), a consumer packaged goods holding company, today released its 2023 Environmental, Social and Governance (ESG) report. The report details Post’s enterprise-wide approach and progress with integrating ESG considerations across four strategic pillars: Sourcing, Operational, Product and Social, including spotlighting unique initiatives within each operating company. In fiscal year 2023, Post made meaningful progress across |
Post Holdings (POST) Ups Adjusted EBITDA View on Latest BuyoutPost Holdings (POST) updates its adjusted EBITDA guidance for fiscal 2024, which includes contributions from the Perfection Pet Foods acquisition. |
Post Holdings Reports Avian Influenza at Third-Party Contracted Facilities and Updates Fiscal Year 2024 Adjusted EBITDA OutlookST. LOUIS, Dec. 07, 2023 (GLOBE NEWSWIRE) -- Post Holdings, Inc. (NYSE:POST), a consumer packaged goods holding company, today provided information regarding avian influenza incidents at two of Michael Foods’ third-party contracted egg-laying facilities. Post also updated its non-GAAP Adjusted EBITDA guidance for fiscal year 2024. Avian Influenza Discussion Michael Foods’ third-party contracted egg-laying flocks in Iowa and Ohio tested positive for avian influenza. The facilities house approxima |
Post Holdings (POST) Buys Perfection Pet Foods, Boosts PortfolioPost Holdings (POST) acquires Perfection Pet Foods, enhancing its manufacturing capabilities and diversifying into the pet food space. |
POST Price Returns
| 1-mo | 4.96% |
| 3-mo | 3.41% |
| 6-mo | 16.92% |
| 1-year | 28.18% |
| 3-year | 59.56% |
| 5-year | 47.26% |
| YTD | 23.75% |
| 2023 | -2.44% |
| 2022 | 20.10% |
| 2021 | 11.60% |
| 2020 | -7.42% |
| 2019 | 22.41% |
Continue Researching POST
Want to do more research on Post Holdings Inc's stock and its price? Try the links below:Post Holdings Inc (POST) Stock Price | Nasdaq
Post Holdings Inc (POST) Stock Quote, History and News - Yahoo Finance
Post Holdings Inc (POST) Stock Price and Basic Information | MarketWatch
Loading social stream, please wait...