PRA Group, Inc. (PRAA): Price and Financial Metrics

PRA Group, Inc. (PRAA): $21.88

0.96 (+4.59%)

POWR Rating

Component Grades

Momentum

C

Stability

C

Sentiment

Quality

C

PRAA Price/Volume Stats

Current price $21.88 52-week high $43.34
Prev. close $20.92 52-week low $17.74
Day low $20.83 Volume 433,900
Day high $21.91 Avg. volume 361,957
50-day MA $30.31 Dividend yield N/A
200-day MA $34.53 Market Cap 857.04M

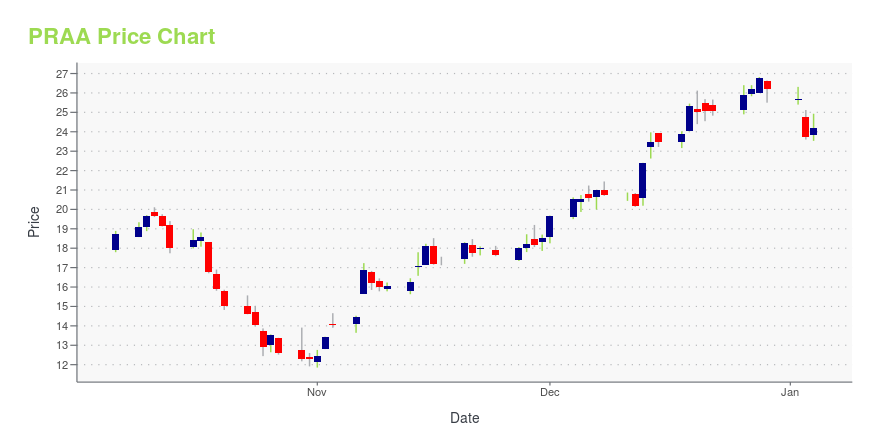
PRAA Stock Price Chart Interactive Chart >

PRAA POWR Grades

  • PRAA scores best on the Quality dimension, with a Quality rank ahead of 58.83% of US stocks.
  • The strongest trend for PRAA is in Growth, which has been heading down over the past 179 days.
  • PRAA's current lowest rank is in the Growth metric (where it is better than 1.34% of US stocks).

PRAA Stock Summary

  • PRAA's current price/earnings ratio is 42.54, which is higher than 85.36% of US stocks with positive earnings.
  • As for revenue growth, note that PRAA's revenue has grown -15.81% over the past 12 months; that beats the revenue growth of only 13.28% of US companies in our set.
  • Shareholder yield, a measure of how much is returned to shareholders via dividends and share repurchases, for PRAA comes in at -54.3% -- higher than that of only 9.92% of stocks in our set.
  • If you're looking for stocks that are quantitatively similar to PRA GROUP INC, a group of peers worth examining would be SNPO, BRP, TLYS, CWK, and ELMD.
  • Visit PRAA's SEC page to see the company's official filings. To visit the company's web site, go to www.pragroup.com.

PRAA Valuation Summary

  • PRAA's price/earnings ratio is 38.7; this is 355.29% higher than that of the median Financial Services stock.
  • Over the past 243 months, PRAA's EV/EBIT ratio has gone down 0.2.

Below are key valuation metrics over time for PRAA.

Stock Date P/S P/B P/E EV/EBIT
PRAA 2023-05-19 0.8 0.6 38.7 19.1
PRAA 2023-05-18 0.8 0.6 39.0 19.2
PRAA 2023-05-17 0.8 0.6 40.0 19.3
PRAA 2023-05-16 0.8 0.6 39.5 19.2
PRAA 2023-05-15 0.8 0.6 40.1 19.3
PRAA 2023-05-12 0.8 0.6 38.6 19.1

PRAA Growth Metrics

    The 3 year net income to common stockholders growth rate now stands at 175.99%.
  • Its 2 year cash and equivalents growth rate is now at -56.06%.
  • The 5 year cash and equivalents growth rate now stands at 119.21%.
PRAA's revenue has moved up $7,554,000 over the prior 33 months.

The table below shows PRAA's growth in key financial areas (numbers in millions of US dollars).

Date Revenue Operating Cash Flow Net Income to Common Stock
2022-09-30 1,000.61 43.228 135.464
2022-06-30 1,019.501 21.524 145.212
2022-03-31 1,046.868 41.973 164.724
2021-12-31 1,095.732 84.925 183.158
2021-09-30 1,112.652 48.628 178.68
2021-06-30 1,116.818 40.841 186.692

PRAA's Quality Factors

The “Quality” component of the POWR Ratings focuses on 31 different factors of a companies fundamentals and operational strength. Here are some key insights as we drill into the specifics of these quality attributes.
  • PRAA has a Quality Grade of C, ranking ahead of 62.57% of graded US stocks.
  • PRAA's asset turnover comes in at 0.26 -- ranking 460th of 563 Business Services stocks.
  • CASS, EEX, and TYL are the stocks whose asset turnover ratios are most correlated with PRAA.

The table below shows PRAA's key quality metrics over time.

Period Asset Turnover Gross Margin ROIC
2021-06-30 0.260 1 0.059
2021-03-31 0.258 1 0.060
2020-12-31 0.248 1 0.052
2020-09-30 0.244 1 0.049
2020-06-30 0.240 1 0.047
2020-03-31 0.236 1 0.039

PRAA Price Target

For more insight on analysts targets of PRAA, see our PRAA price target page. And for a list of of all stocks sorted by upside potential based on analyst target price, see our Top Price Target page.

Average Price Target $42.50 Average Broker Recommendation 1.6 (Moderate Buy)

PRA Group, Inc. (PRAA) Company Bio


PRA Group engages in the purchase, collection, and management of portfolios of defaulted consumer receivables in North America and Europe. It is involved in the acquisition, collection, and processing of unpaid and normal-course accounts receivable owed to credit grantors, governments, retailers, and others. The company was founded in 1996 and is based in Norfolk, Virginia.


PRAA Latest News Stream


Event/Time News Detail
Loading, please wait...

PRAA Latest Social Stream


Loading social stream, please wait...

View Full PRAA Social Stream

Latest PRAA News From Around the Web

Below are the latest news stories about PRA GROUP INC that investors may wish to consider to help them evaluate PRAA as an investment opportunity.

PRA Group to Present at the William Blair 43rd Annual Growth Stock Conference

PRA Group, Inc. (Nasdaq: PRAA) (the "Company"), a global leader in acquiring and collecting nonperforming loans, will present to investors attending the William Blair 43rd Annual Growth Stock Conference on Wednesday, June 7, 2023, at 11:20am CT. A webcast of this event will be available in the Investor Relations section of the Company's website at https://ir.pragroup.com/events-and-presentations.

Yahoo | May 31, 2023

PRA Group Insiders Added US$1.1m Of Stock To Their Holdings \

Multiple insiders secured a larger position in PRA Group, Inc. ( NASDAQ:PRAA ) shares over the last 12 months. This is...

Yahoo | May 22, 2023

PRA Group (PRAA) Incurs Q1 Loss Due to Lower Portfolio Income

PRA Group's (PRAA) Q1 results grapple with high expenses, lower portfolio income and a drop in cash collections.

Yahoo | May 9, 2023

PRA Group (PRAA) Reports Q1 Loss, Misses Revenue Estimates

PRA Group (PRAA) delivered earnings and revenue surprises of -433.33% and 30.23%, respectively, for the quarter ended March 2023. Do the numbers hold clues to what lies ahead for the stock?

Yahoo | May 8, 2023

PRA Group Reports First Quarter 2023 Results

PRA Group, Inc. (Nasdaq: PRAA) (the "Company"), a global leader in acquiring and collecting nonperforming loans, today reported its financial results for the first quarter of 2023 ("Q1 2023").

Yahoo | May 8, 2023

Read More 'PRAA' Stories Here

PRAA Price Returns

1-mo -36.38%
3-mo -46.28%
6-mo -35.11%
1-year -40.66%
3-year -44.17%
5-year -45.84%
YTD -35.23%
2022 -32.72%
2021 26.60%
2020 9.26%
2019 48.95%
2018 -26.60%

Get Free Updates

Join thousands of investors who get the latest news, insights and top rated picks from StockNews.com!